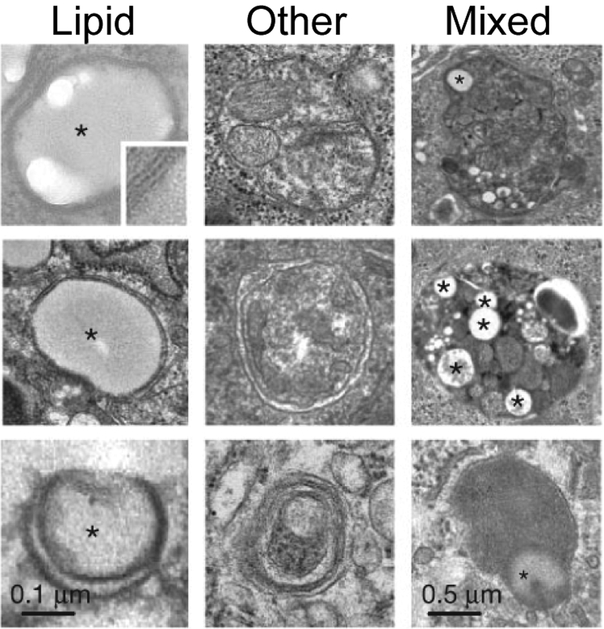
Figure 5: LD turnover by lipophagy.
Electron micrographs of cultured hepatocytes treated with excess oleic acid or methionine/choline-deficient medium. Shown are autophagic vacuoles containing only lipids, other cargo, or mixed (lipids plus other cargo). Lipids are indicated by stars. Modified with permission from Singh et al., 2009.

