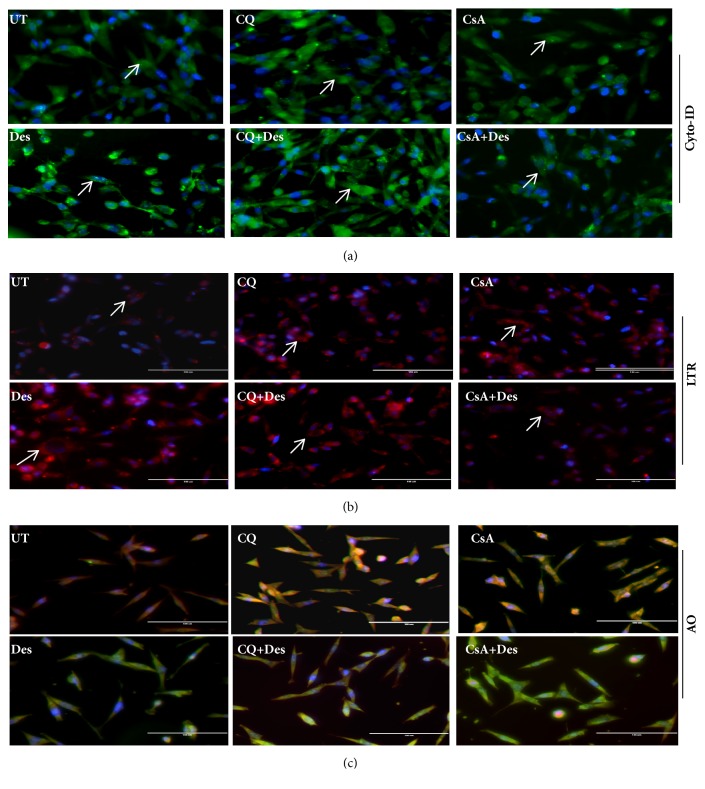
Figure 5.
(a)-(c) Quantification of autophagosomes and lysosomes in desiccated HCE-T cells. (a) Cyto-Id staining for quantification of autophagosome staining in HCE-T cells under desiccation stress, with and without CQ/CsA treatment (Figure 5(a)). (b) LTR- lysotracker red staining to measure lysosome levels staining in HCE-T cells under desiccation stress, with and without CQ/CsA treatment (Figure 5(b)). (c) AO- Lysosomal pH assessed using acridine orange (AO) staining in HCE-T cells under desiccation stress, with and without CQ/CsA treatment (Figure 5(c)). UT- control or undesiccated cells, Des- HCE-T cells exposed to desiccation, CQ- HCE-T cells treated with chloroquine (CQ), CQ+Des- desiccated HCE-T cells treated with chloroquine (CQ), CsA- HCE-T cells treated with cyclosporine (CsA), and CsA+Des- desiccated HCE-T cells treated with cyclosporine (CsA).

