Figure 4.

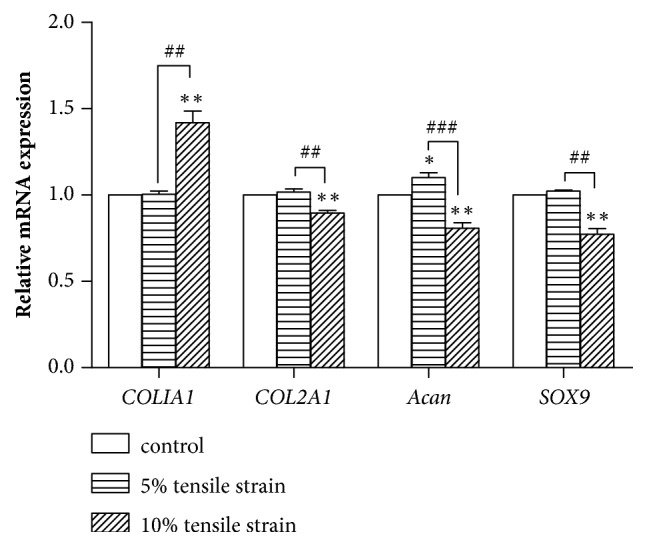
The mRNA expression levels of COL1A1, COL2A1, Acan, and SOX9 (n = 3). ∗P < 0.05, ∗∗P < 0.01, and ∗∗∗P < 0.001 compared with the control group. #P < 0.05, ##P < 0.01, and ###P < 0.001 in the indicated groups.

The mRNA expression levels of COL1A1, COL2A1, Acan, and SOX9 (n = 3). ∗P < 0.05, ∗∗P < 0.01, and ∗∗∗P < 0.001 compared with the control group. #P < 0.05, ##P < 0.01, and ###P < 0.001 in the indicated groups.