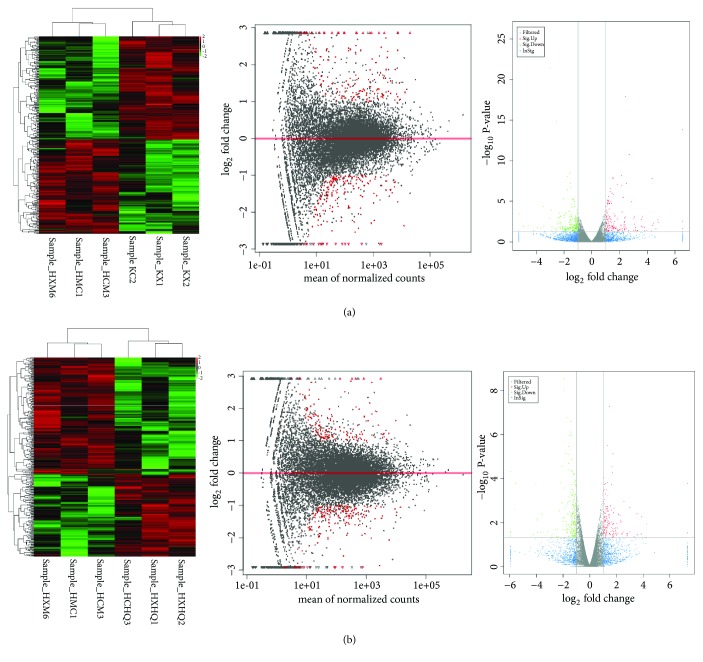
Figure 4.
(a) Hierarchical clustering of the quantitative information from significantly changed gene expression by RNA-seq. Compared with the normal control group, the rat metabolism was related to YDCS; red indicates the high expression gene, and green indicates the low expression gene. (b) Hierarchical clustering of the quantitative information from significantly changed gene expression by RNA-seq, compared with YDCS group. The rat metabolism was related to the RAWA group; red indicates the high expression gene, and green indicates the low expression gene. The difference that generated is reflected in the MA diagram. The X-axis is the mean value of all samples used for comparison after standardization, and the Y-axis is log2 fold change. Red marked the difference genes in significance (according to differential screening conditions). The differences generated by comparison were reflected in the volcanic map, the gray and blue genes were nonsignificant differences, and the red and green genes were the significant difference genes. The horizontal axis is the display of log2 fold change, and the vertical axis is the display of log10 P-value.).

