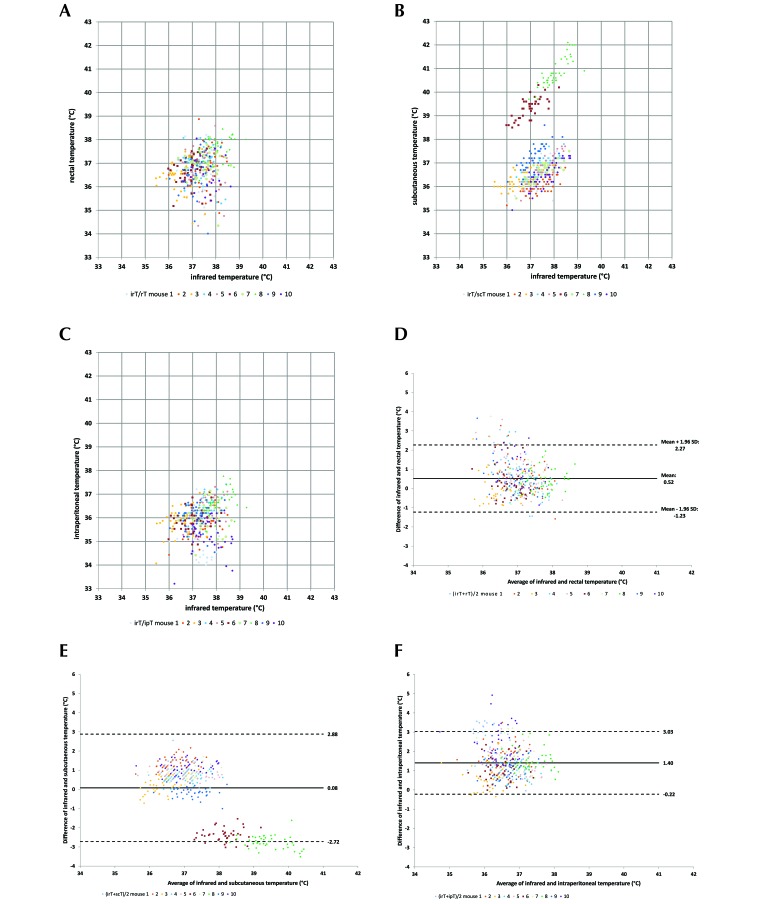
Figure 2.
Bland–Altman plots comparing the temperature measured by using an infrared camera (IRC) and the compared with (A) the rectal temperature measured by using a rectal probe, (B) the subcutaneous temperature measured by using a transponder, or (C) the intraperitoneal temperature by using a data logger (n = 10 mice × 43 measures). Data points represent the values measured by using 2 methods; each mouse is represented by a different color. Structure of a Bland–Altman plot comparing temperatures obtained with the 2 compared methods. Scatterplots present the results of the differences between the values of the 2 methods on the y-axis and the average of the paired values of the 2 methods on the x-axis. The infrared temperature obtained by using the IRC is compared with the (D) rectal temperature by rectal probe, (E) subcutaneous temperature by using a transponder, and (F) intraperitoneal temperature by using a data logger.

