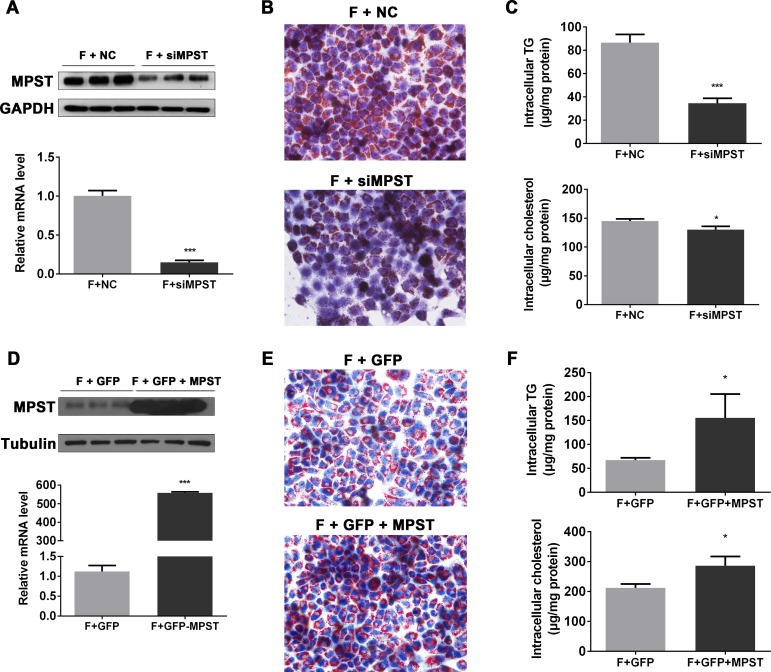
Figure 3.
Partial knockdown of MPST markedly attenuates while overexpression of MPST exacerbates FFA-induced fat accumulation in hepatocyte in vitro. (A–C) After transfection with scrambled siRNA (negative control) and MPST siRNA for 24 hours, L02 cells were treated with FFAs for 24 hours. (A) Western blot and qPCR analyses were performed to determine MPST expression. (B) Representative images of Oil Red O staining of L02 cells is shown. Original magnification ×400. (C) Intracellular TG and TC contents were determined. (D–F) After transfecting with plasmid containing GFP with or without full-length MPST DNA for 24 hours, L02 cells were treated with FFAs for 24 hours. (D) Western blot and qPCR analyses were performed to determine MPST expression. (E) Representative images of Oil Red O staining of L02 cells is shown. Original magnification ×400. (F) The intracellular TG and TC contents were determined. The results are expressed as the mean±SD of three independent experiments. *p<0.05, **p<0.01, ***p<0.001. FFA, free fatty acid; GAPDH, glyceraldehyde-3-phosphate dehydrogenase; GFP, green fluorescent protein; MPST, 3-mercaptopyruvate sulfurtransferase; mRNA, messenger RNA; qPCR, quantitative PCR; siRNA, small interfering RNA; TC, total cholesterol; TG, triglyceride.

