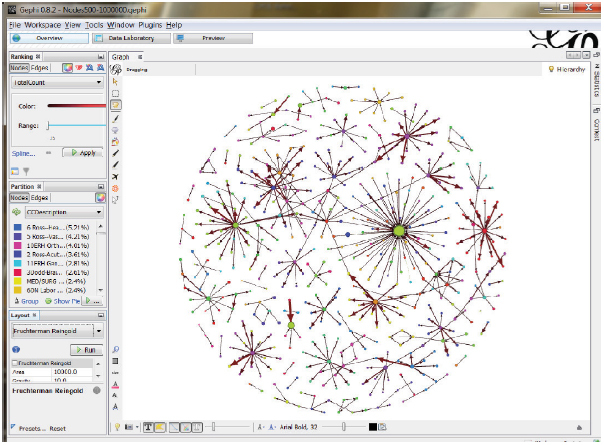
Fig. 1.

Gephi © graphical network display of overall enterprise top 500 call pairs calls out of the one million calls using the Fruchterman-Reingold force-directed layout algorithm. The left column and margins of the Gephi screen show tools to select the layout algorithm as well as to label the nodes (phone numbers) and edges (calls) with information such as cost center name, call volume or duration. The large node in the right upper quadrant represents voice mail and many of the smaller sub-networks correspond to large inpatient nursing units. Here label display is turned off to show the overall structure of high-frequency telephone traffic.
