
Fig. 7.
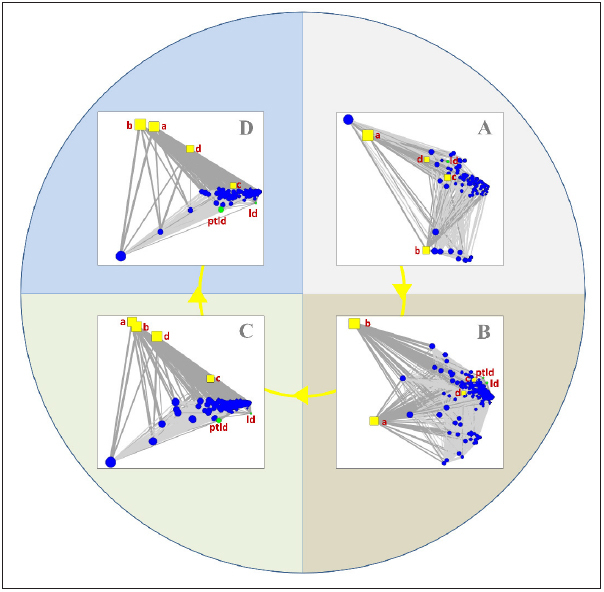
The second group of subnetworks was constructed using the principal component layout for the four time periods separately. The tight connections between the high doses (“c” and “d” nodes) with “pltd” and “ld” are clearer than in the previous, cumulative subnetworks. (A) the subnetwork for the first period with cases having a Therapy Start Date until June 7, 2003 – the “ld” node is tightly connected to the “d” node indicating a strong association between “ld” and high rATG doses in the first period; (B) the subnetwork for the second period with cases having a Therapy Start Date from June 8, 2003 to November 9, 2007 – the “ptld” node appears next to the “ld” node, and they are both tightly connected to the “c” and “d” nodes that represent the high rATG doses (>8mg/kg); (C) the subnetwork for the third period with cases having a Therapy Start Date from November 10, 2007 to February 14, 2011 – the “ptld” and “ld” nodes are mainly connected to the “c” node; (D) the subnetwork for the fourth period with cases having a Therapy Start Date from February 15, 2011 to December 31, 2015 – the “ptld” and “ld” nodes are connected to the “c” node as in the previous subnetwork. ld: lymphoproliferative disorder; ptld: post-transplant lymphoproliferative disorder; a: dose range 0–4.00 mg/kg; b: dose range 4.01–8.00 mg/kg; c: dose range 8.01–12.00 mg/kg; d: doses ≥12.01 mg/kg; rATG: rabbit Anti-Thymocyte Globulin.