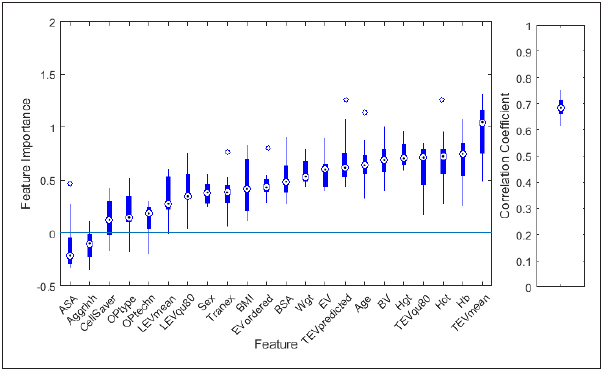
Fig. 3.

Feature importance (left) of the 22 features used during modelling (see table 1 for a description of the features) and correlation coefficient between actual and predicted transfused red blood cell (RBC) volume (right). 10 models were built applying a leave-10%-out approach. Boxplots summarize the results achieved for these 10 models.
