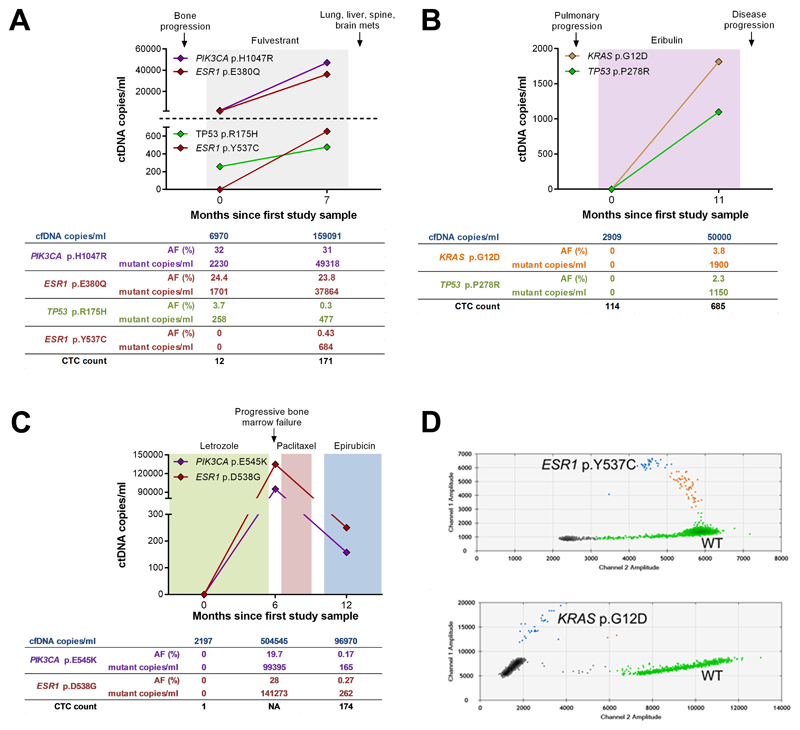
Fig. 2. Longitudinal follow up of circulating tumor DNA in 3 patients with high CTC counts.
(A - C) Total cfDNA and circulating tumor DNA levels. (A) patient CTCM138; (B) patient CTCM105; (C) patient CTCM292. Endocrine or cytotoxic therapies are indicated by colored shading. The number of cfDNA copies obtained from the blood sample, mutant allele frequency (AF), number of mutant copies and CTC count is given below each graph. NA = Not available or CellSearch failed. (D) Digital PCR detection of low frequency mutations in circulating tumour DNA. ESR1 p.Y537C mutation, patient CTCM138 (top) and KRAS p.G12D mutation, patient CTCM105 (bottom). Green dots represent HEX-labelled wild-type (WT), blue dots represent FAM-labelled mutant DNA and brown dots represent double positive droplets containing WT and mutant DNA. Grey dots represent empty droplets.

