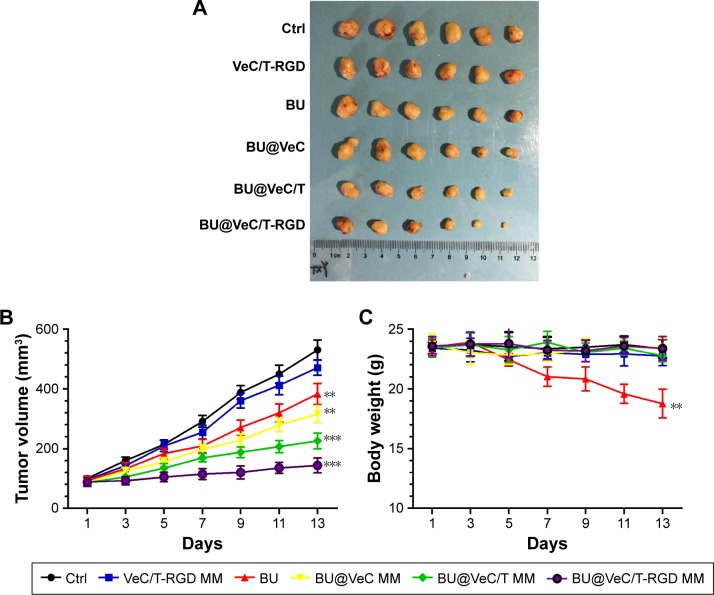
Figure 7.
The tumor volume (A), changes in tumor volume with time after tumor cell inoculation (B), and body weight (C) of tumor-bearing mice during the period of treatment. Data are mean±SD (n=6). **P<0.01 and ***P<0.001 indicate statistical significance levels compared with the control.
Abbreviations: BU, bufalin; MM, mixed micelles.

