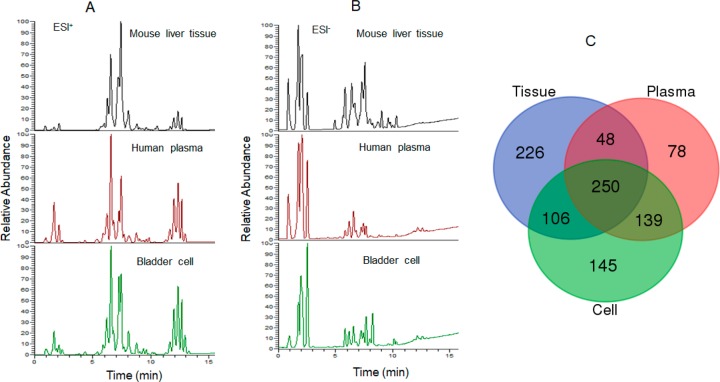
Figure 2.
Representative chromatograms of multiple matrices by nontargeted lipidomics analyses in positive (A) and negative (B) modes. (C) Venn diagram of qualitative lipid species from nontargeted lipid profiling of multiple matrices by tR, MS, and MS/MS. These lipids were from 19 subclasses including 515 lipids in human plasma, 630 lipids in mouse liver tissue, and 640 lipids in cells.

