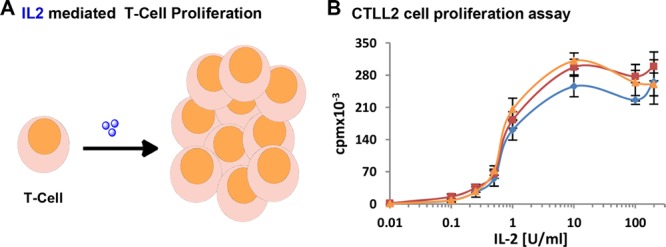
Figure 3.

(A) Schematic diagram for IL-2-induced T-cell proliferation. IL-2 is depicted as blue spheres. (B) CTLL2 (T-cells) proliferation assay with titration of increasing concentrations of IL-2 1 (blue), IL2-Cy3 2 (red), and IL2-Cy3-Cy5 3 (orange).
