
Figure 6. Average percent change of methylation values, β’s, after normalization by best and worth performing samples.
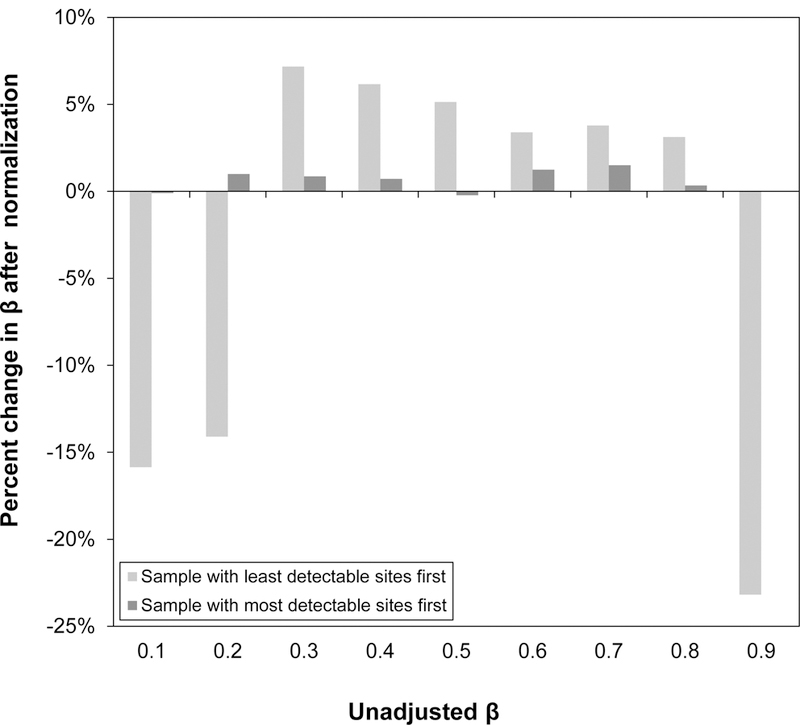
Mean percent change in β’s, values ranging from 0.1 to 0.9, based on normalization by the lowest quality sample (largest amount of CpG sites with p<0.05) and the highest quality sample (least amount of CpG sites with p<0.05) over all samples (n=432). While normalization by the highest quality sample changed the β’s only slightly (<10% on average), normalization by the lowest quality sample tended to change the low and high methylation β’substantially (>10% on average).