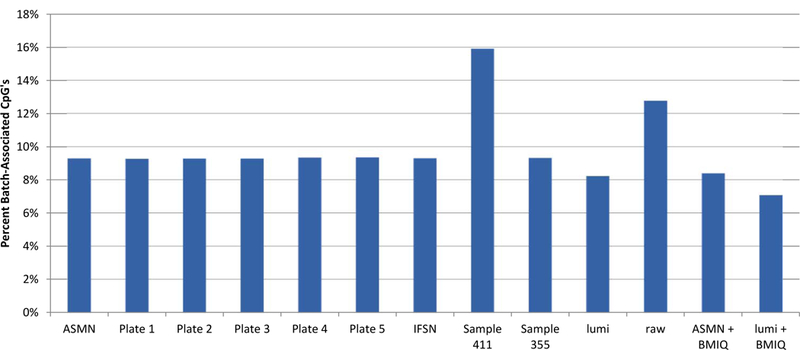
Figure 8. Percent of 450K array CpG sites associated with chip batch (p<0.01) shown by normalization method.

Normalization methods include: All sample mean normalization (ASMN), normalization by RN-factors taken as the mean control probe values for each of the plates (1–5) run, normalization by the worst performing sample’s reference normalization (RN) factor (sample 411) and the best performing sample’s RN-factor (sample 355), lumi smooth quantile normalization, and both the ASMN and lumi normalization followed by beta-mixture quantile normalization (BMIQ). Batch association was evaluated by ANOVA for each of the n=485,512 CpG sites interrogated.
