
Figure 10.
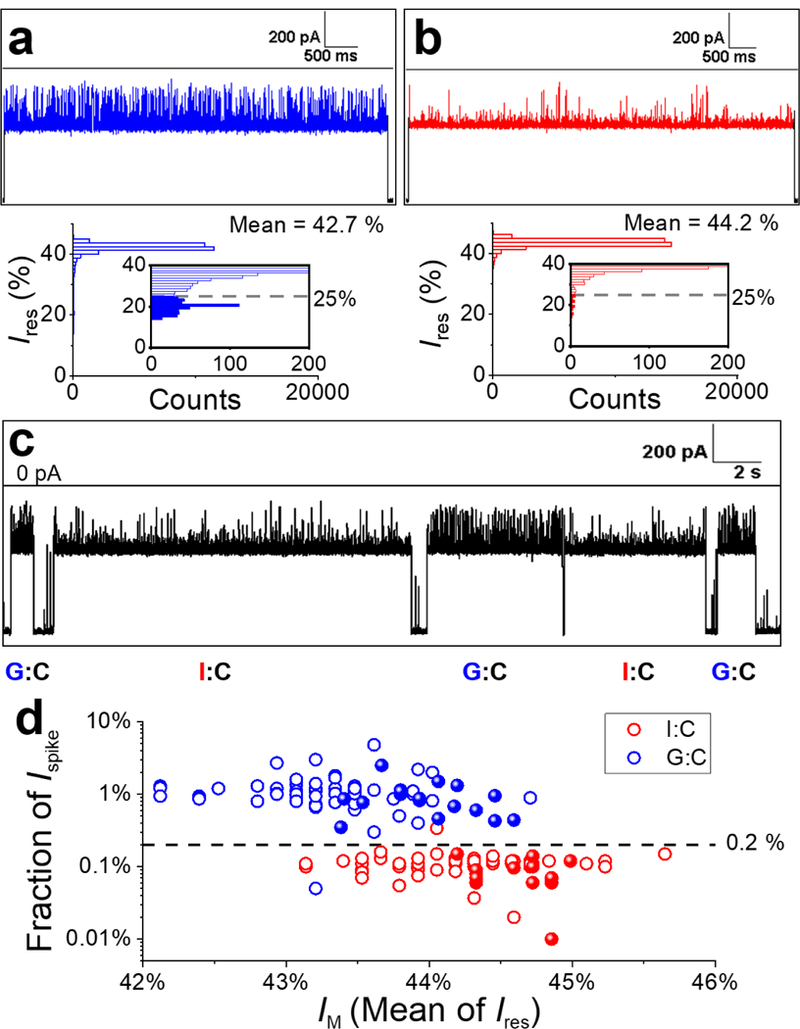
Single-molecule differentiation of G:C- and I:C-containing duplexes using the γ-HL nanopore. (a-b) Sample I-t trace corresponding to a G:C (a) or I:C (b) duplex captured by the protein channel in separate experiments and the corresponding all-point histograms of blockade current. Inset: Zoomed-in view of the histograms showing the current distributions of upward spikes for G:C and I:C duplex, respectively. The deeper blockade currents (< 25%) are plotted as filled columns in the insets. (c) Sample I-t trace for solution containing a 1:1 mixture of G:C and I:C duplexes. Extended I-t trace is shown in Figure S17. (d) Scatter plot of fraction of Ispike (percentage of counts with Ires< 25% in all-point histograms) vs mean of the blockade current (IM) for G:C (blue) and I:C (red) duplexes. Each data point represents a measurement of a single dsDNA molecule. Open circles represent data from a solution of a single component (G:C or I:C) for establishing the threshold for differentiation (N=75 for each). Solid spheres are data from the 1:1 mixture of G:C and I:C dsDNA molecules and are identified based on the threshold (N=32). Experiments were carried out at −120 mV in 3 M KCl, 20 mM HOAc/KOAc, pH 5 at 20.0 °C. Data were filtered by a Bessel filter at 10 kHz. The I-t traces (a-c) were post-filtered at 1 kHz for presentation.