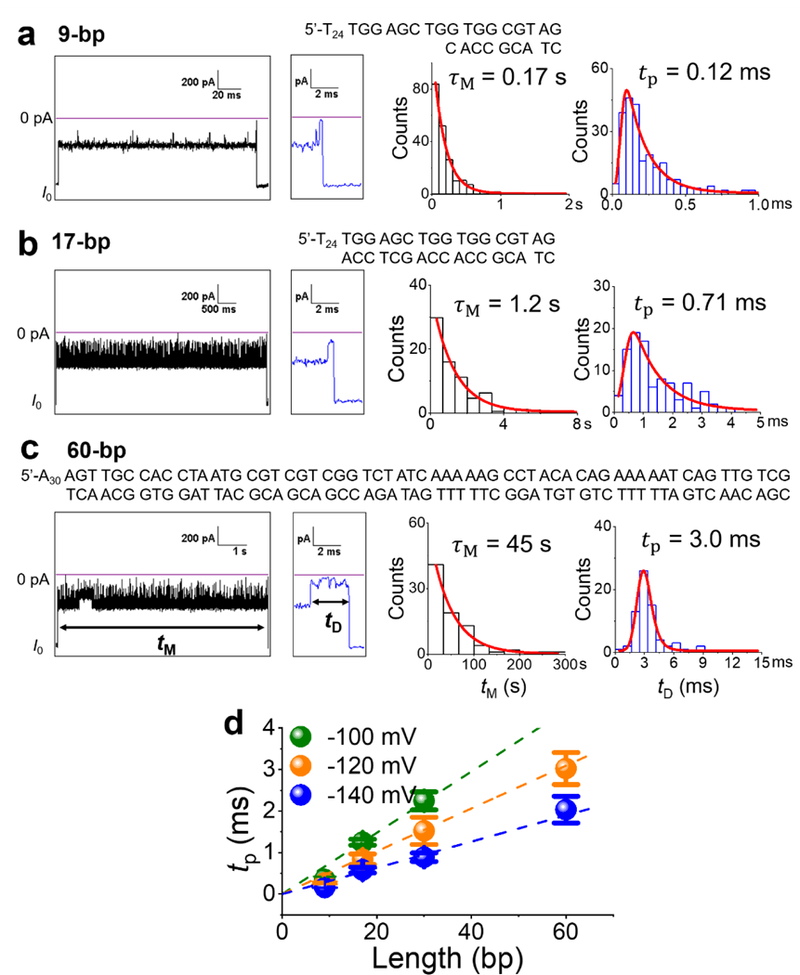
Figure 11.

(a-c) Typical I-t traces recorded at −120 mV for the translocation of 9-, 17-, and 60-bp dsDNA, with an expanded view of the end of the event. Only successful translocation events are analyzed. Additional examples for each dsDNA are shown in Figure S18-S20. Duration histograms of and are fitted by exponential decay and exponentially modified Gaussians (red curves), respectively. The most probable translocation times are obtained from the fitted curves and plotted in (d) for applied potentials of−100, −120, and −140 mV. Note that the 60-bp dsDNA did not translocate through the protein channel at the lowest applied potential, i.e., −100 mV. The y-axis error bars were obtained from 3 or 4 experiments. The data were collected in 3 M KCl, 20 mM HOAc/KOAc, pH 5.0, using a 10-kHz Bessel filter (100-kHz Bessel filter for 9-bp data) and post-filtered at 3 kHz for presentation.
