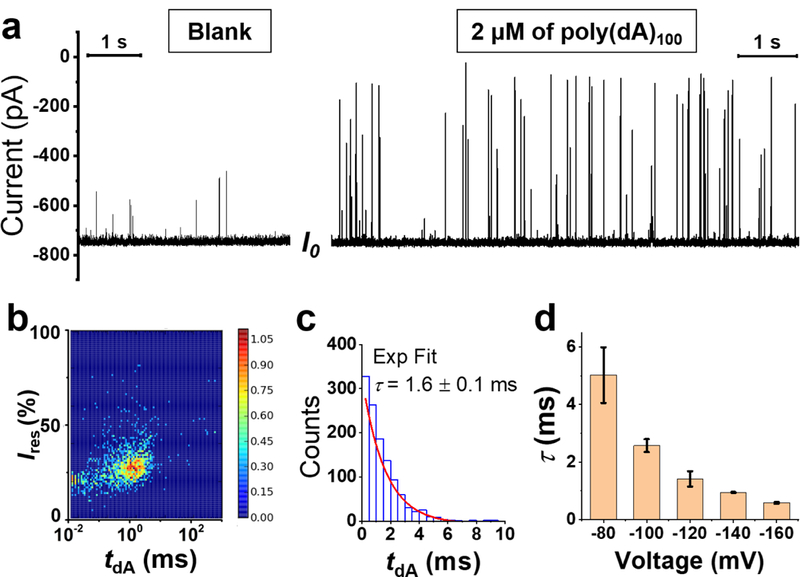
Figure 5.

Translocation of ssDNA (poly(dA)100) through the γ-HL nanopore. (a) Left: open-channel I-t trace at −120 mV in the absence of ssDNA. Right: The addition of 2 μM ssDNA in the cis chamber results in short but deep current blockades. Expanded I-t trace is shown in Figure S9. (b) Density plot (N=1175) for residual current (Ires) vs event duration (tdA). (c) Histogram of ssDNA translocation duration (N=1039) by excluding the fast collision events (tdA <0.04 ms) and incomplete translocation events (Ires ≥40%). The distribution of tdA is well fitted by a first-order exponential kinetic with a time constant (τ) of 1.6 ms (red line). (d) Effect of voltage on the translocation time constant, τ. The error bars represent standard deviations from the fittings of 3 repeated experiments (N=800–2500 in each experiment). Recordings were carried out at 20 °C in 3 M KCl, 20 mM HOAc/KOAc, pH 5.0. I-t traces were sampled at 500 kHz and post-filtered at 50 kHz for presentation.
