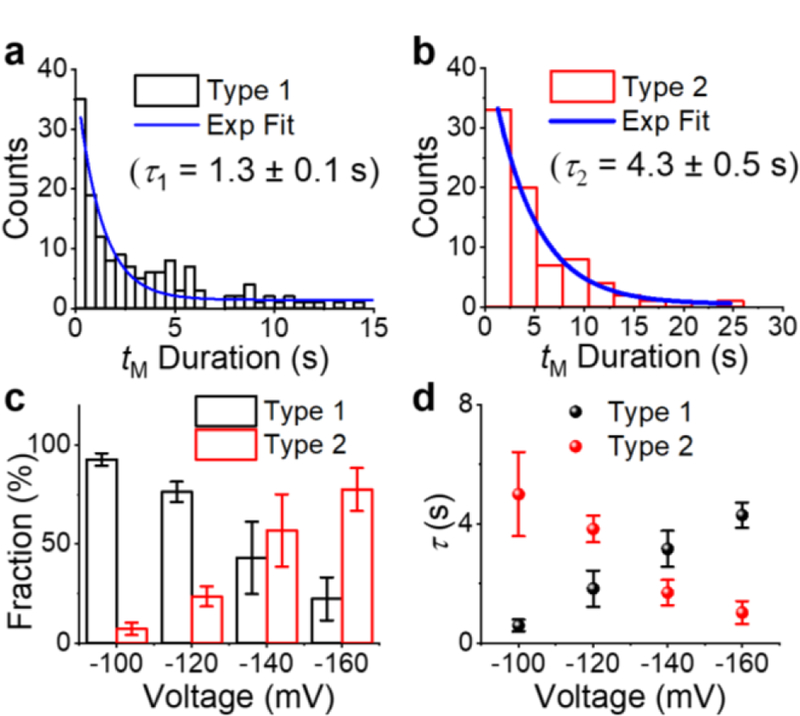
Figure 7.

(a-b) Histograms of event duration of (a) Type 1 and (b) Type 2 events at −120 mV. Blue curves are the best exponential fits. Effect of voltage on the (c) fraction and (d) duration (τ) of Type 1 (black) and Type 2 (red) events. Error bars represent standard deviations from 3 or 4 repeated measurements (N=30–500 in each experiment). Experiments were carried out in 3 M KCl, 20 mM HOAc/KOAc, pH 5.0, at 20.0 °C.
