
Figure 2. Box plots showing the distribution of methylation betas in cord blood and in 7- year old children.
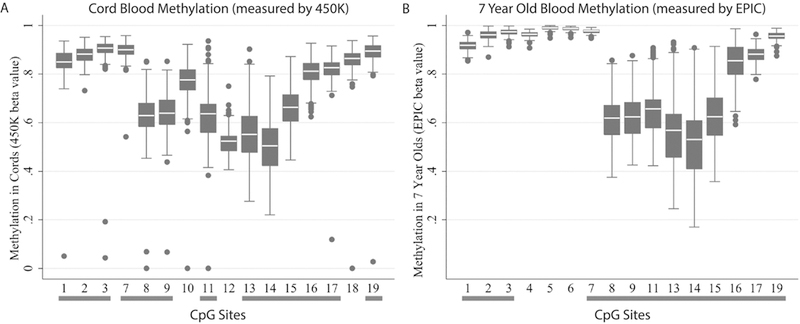
PON1 DNA methylation in (a) cord blood measured by 450K and (b) 7-year old children measured by EPIC. Methylation levels are shown as beta values for ease of interpretation. At both ages, CpG sites 1 to 8 and 16 to 19 are highly methylated, while methylation levels are lower in CpG sites 8 to 15. CpG sites common to both 450K and EPIC assays are indicated with a grey bar underneath. CpG sites 4, 5, and 6 were not shown in (a) because they were not assessed by 450K and sites 10 and 18 were not shown in (b) because they were not assessed by EPIC.