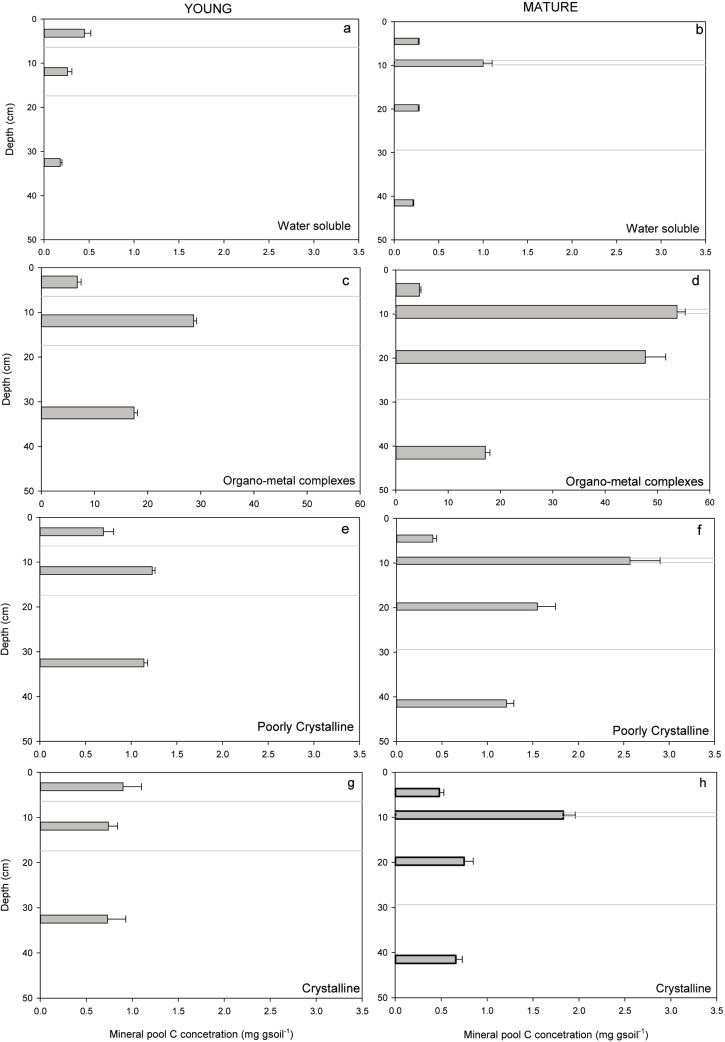
Fig 3.
Carbon (mg g soil-1) from sequential selective dissolutions of soil from horizons of podzols at a Young (left panels) and Mature (right panels) forests. Grey lines indicate the position of Ae, Bh, Bf and BC horizons in sequence through depth for the Young and Mature sites. Note the large difference in scales for the C content for the following mineral fractions which represent a,b) water soluble, c,d) organometal and e,f) poorly crystalline and g,h) crystalline secondary minerals, extracted sequentially with a,b) water, c,d) pyrophosphate, e,f) hydroxylamine, and then g,h) dithionite respectively.

