Fig. 1.
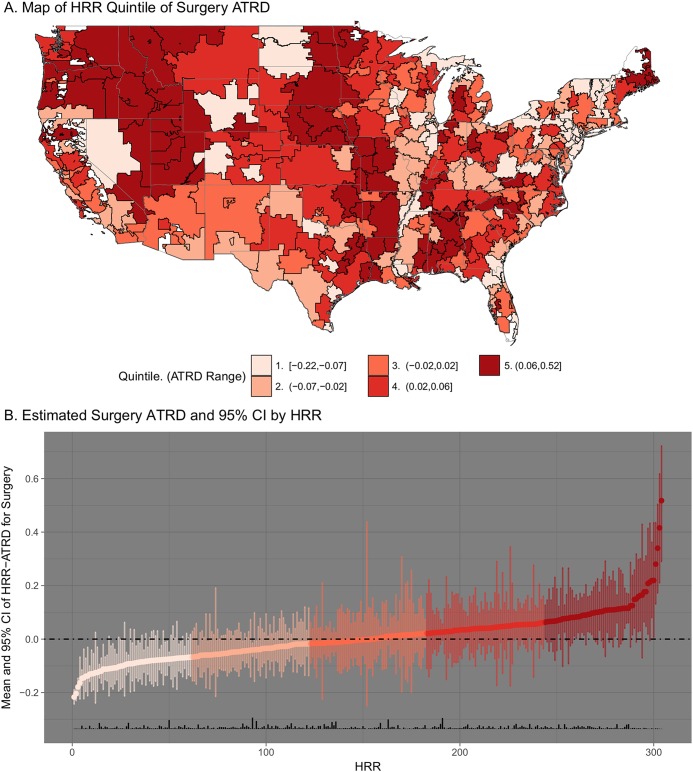
Fig. 1-A Hospital referral regions (HRRs) across the United States, colored by quintile of area treatment rate differential (ATRD) for surgery. A higher quintile reflects higher use of surgery in the hospital referral region than expected on the basis of average treatment patterns across the entire sample as estimated with use of logistic regression models. The range of values across hospital referral regions in each quintile is shown in the key at the bottom of the figure. Fig. 1-B Estimated ATRDs for surgery across HRRs, in ascending order. The vertical span of each point represents the 95% CI as estimated with the bootstrap method with 4,500 iterations. The color indicates the quintile of ATRD for surgery. The rug plot along the x axis (vertical black bars) shows the relative proportion of the sample that resides in each hospital referral region.

