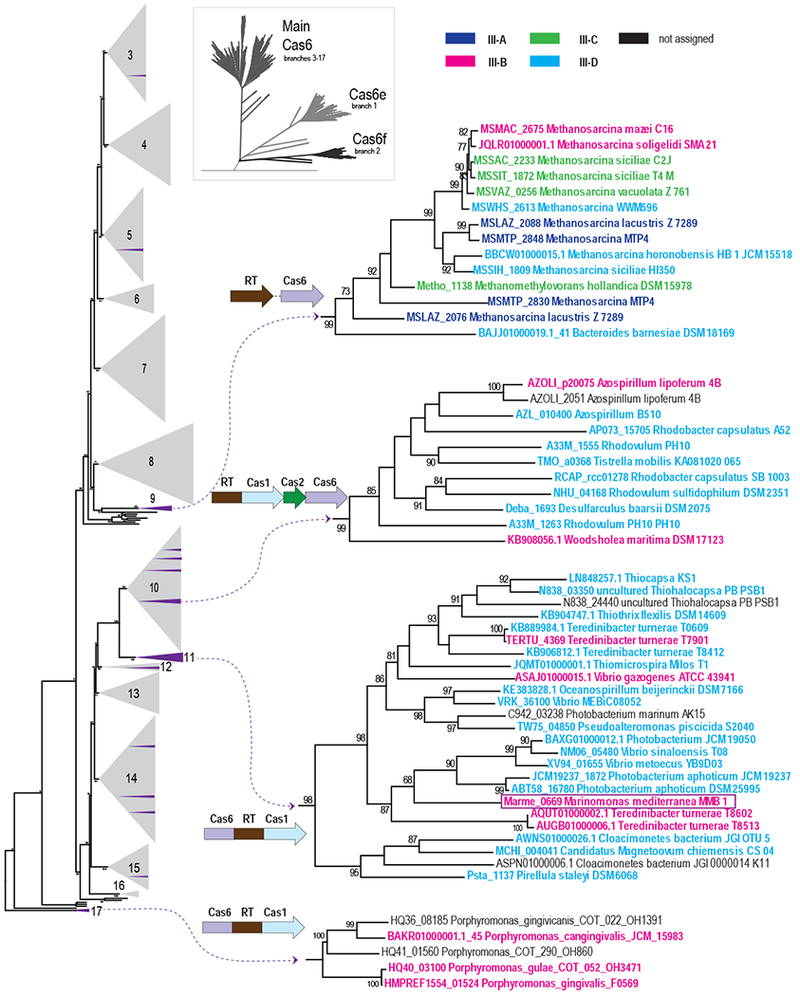
Figure 1. Phylogeny of a Representative Set of Cas6 proteins.

The complete tree was constructed from an alignment of 4,048 Cas6 protein sequences and is depicted schematically in the inset and provided as Data S1. The Cas6 main clade with branches 3 to 17 is shown to the left with collapsed branches shown as numbered gray triangles. Distinct branches that are associated with RT-containing CRISPR-Cas loci are shown in purple with the gray triangles, and four large clades are displayed on the right. Group II intron RTs, RT fragments, and a branch 2 RT associated with Tn7 transposition machinery were excluded from this analysis (see also Figure S1). Each sequence within these clades is identified by a protein locus tag or contig accession number (when a locus tag is unavailable), and a species name; see also Table S1. Branch support values >70% (calculated using FastTree) are indicated. The domain architecture or the most common gene order in the gene neighborhoods of RT and cas6 are shown for each subtree. Additional representative gene orders are shown in Figure S1. The dashed lines connecting the RT and cas6 genes for subtrees from branches 9 indicate that the exact gene arrangement differs among the respective genomes. The CRISPR-Cas subtypes are color-coded as shown at the top right.
