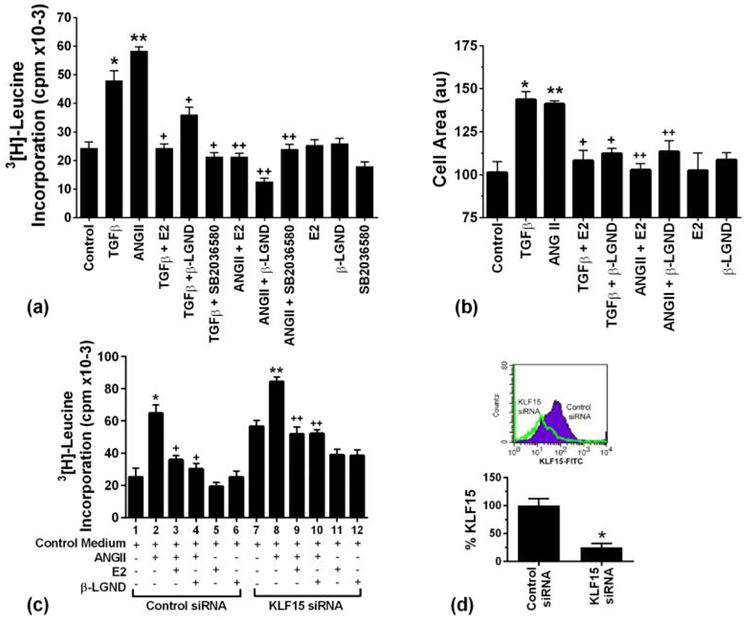
Fig 4. Stimulation of cardiomyocyte hypertrophy by Ang II and TGFβ, opposed by E2 and β-LGND.
(a) Leucine incorporation into protein is stimulated by AngII and TGFβ, inhibited by estrogenic compounds. Data are from 3 exps. *p or **p < 0.05 vs. control, +p < 0.05 for TGFβ versus same + E2, β-LGND, or SB compound. ++p<0.05 for AngII vs. same + E2, β-LGND, or SB compound; (b) Cell area is increased in cardiomyocytes exposed to TGFβ or AngII, opposed by E2 or β-LGND. Data are combined from 3 exps. * or **p < 0.05 vs. control, +p < 0.05 for TGFβ versus same + E2 or β-LGND. ++p<0.05 for AngII vs same + E2 or β-LGND. (c) KLF15 siRNA stimulates cardiac hypertrophy, augments AngII effects, and partially reverses inhibition by E2 or β-LGND. Data are from 3 exps combined. *p<0.05 for control siRNA vs. AngII + control siRNA, **p<0.05 for control siRNA vs KLF15siRNA, +p<0.05 for AngII vs AngII + E2 or β-LGND under control siRNA conditions, ++p<0.05 for KLF15siRNA vs same +AngII, #p<0.05 for AngII + E2 or β-LGND + control siRNA vs AngII + E2 or β-LGND +KLF15 siRNA conditions; and (d) siRNA knockdown of KLF15. Results are cell expression of KLF15 mRNA (RT-PCR) or protein (flow cytometry), under KLF15 siRNA or control siRNA conditions. The bar graph is relative KLF15mRNA from 3 determinations, *p<0.05.

