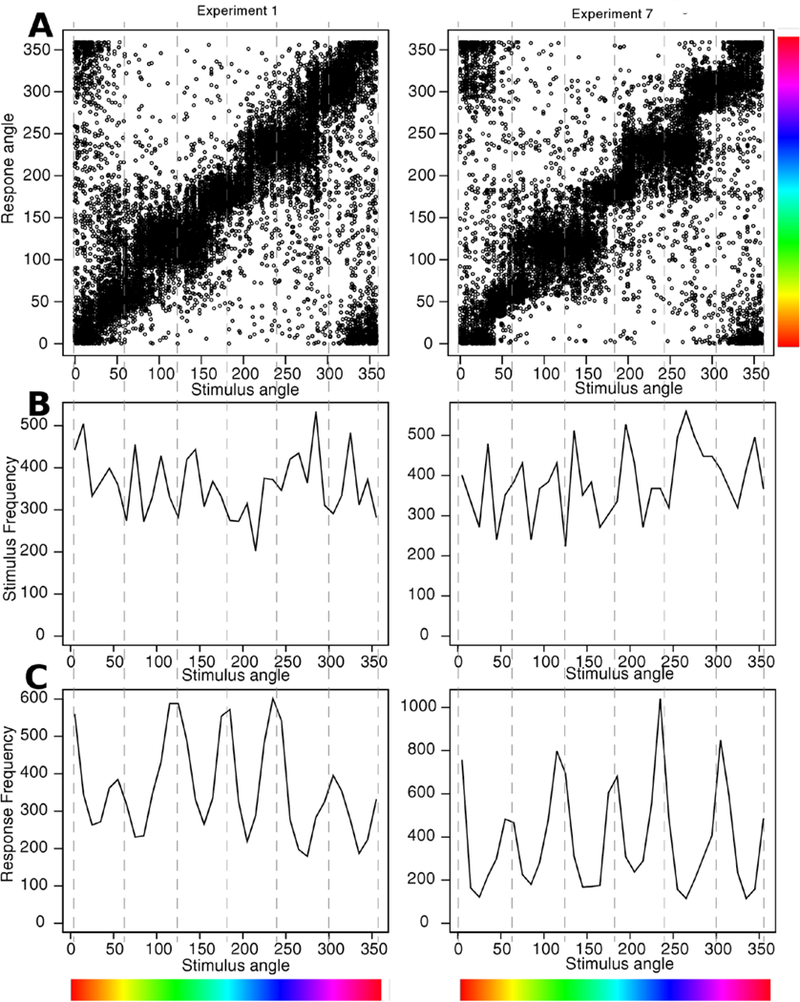
Figure 11.

A: plots of response angle versus stimulus angle for all responses from all subjects for Experiments 1 and 7. The horizontal blobs show a bias to respond within certain ranges. B: plot of the number of stimuli as a function of angle. C: a plot of the number of responses as a function of angle. The vertical dashed lines show the center of the primary and additive colors (red, yellow, green, teal, blue, and purple). The color scale at the bottom and right side shows the colors that corresponds to the angle.
