
Figure 12.
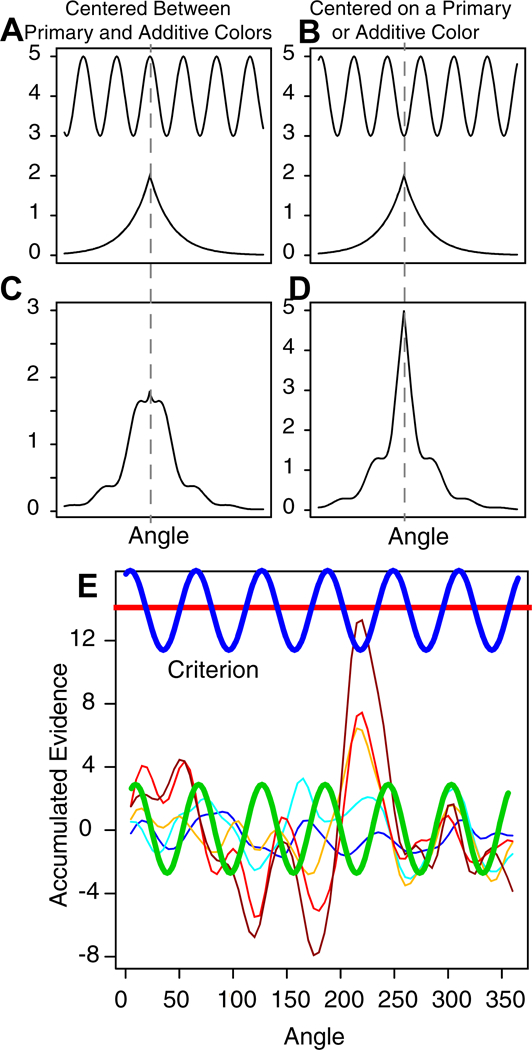
A shows plot of a sinusoidal decision boundary centered on a peak in sinusoid and an illustrative stimulus distribution (this is not based on the model). B is an illustrative plot of the responses produced by multiplying the stimulus representation by the decision bound which shows a flat wide peak. C shows the same plot for the decision boundary centered on a trough. D shows that resulting response distribution is highly peaked with side lobes. E shows the same accumulation of information as in Figure 1C, but with a blue sinusoidal decision boundary (which is equivalent to a constant boundary but with a sinusoidal starting point (the green starting point and red constant boundary).