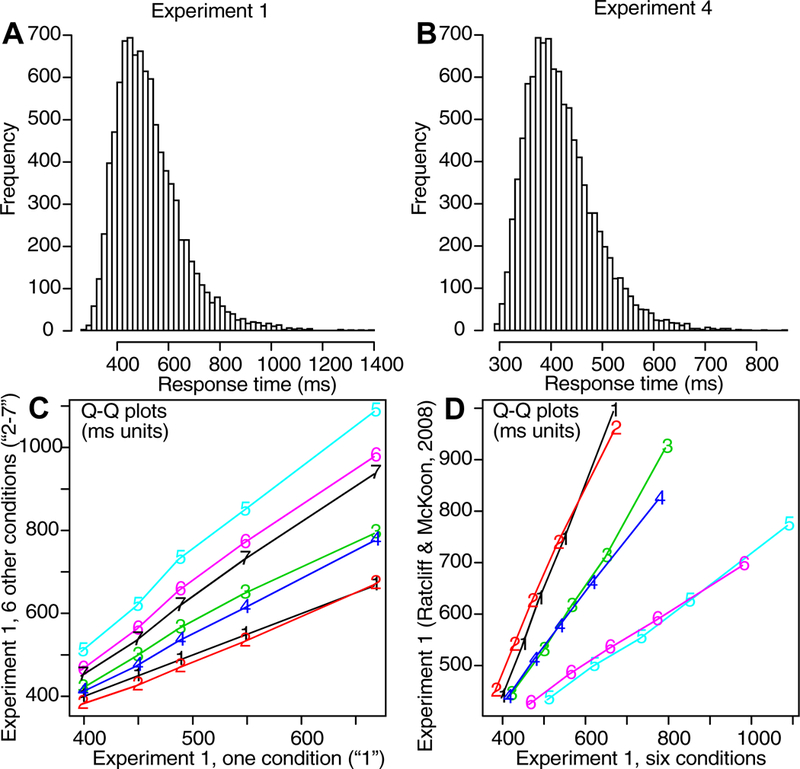
Figure 14.

A and B show sample RT distributions predicted from the model for Experiments 1 and 4 for the easiest condition for correct responses. C shows plots of quantiles from Experiment 1 from the 7 conditions with enough responses to form quantiles plotted against the quantiles from the easiest condition. Results show straight lines which shows similar distribution shapes across condition. D shows plots of quantile RTs averaged over subjects for 6 conditions from Experiment 1 (a continuous color identification task) plotted against 6 conditions from Experiment 1 in Ratcliff and McKoon (2008 - a two choice motion discrimination task) which again show straight lines which suggests similar distribution shapes between tasks and subjects.
