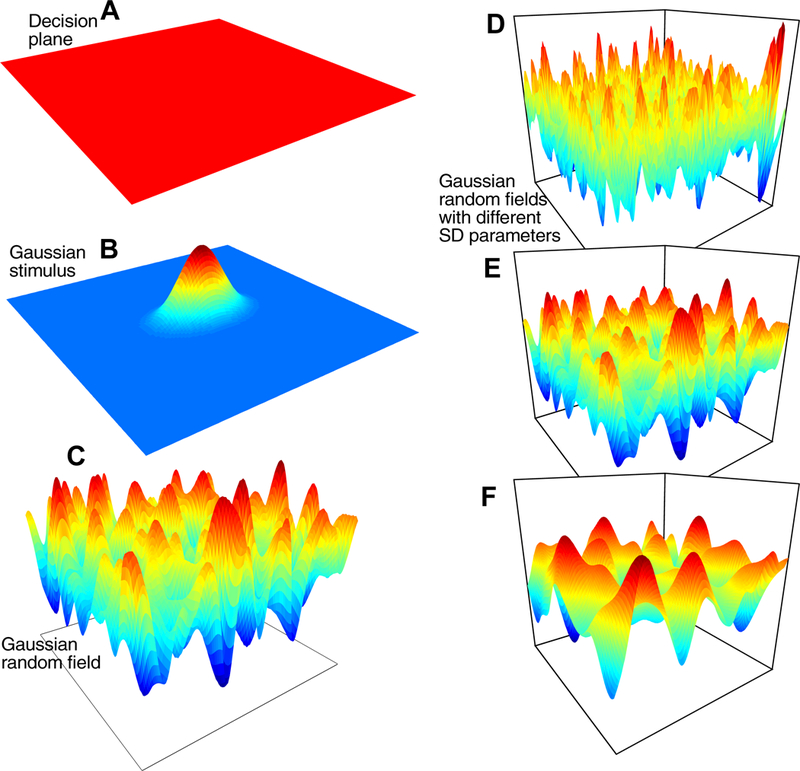
Figure 15.

A representation of the 2D model. A shows a decision plane, B shows a 2D normal distribution of drift rates, and C shows the Gaussian random field noise distribution (by analogy to the Gaussian process distributions in Figure 1). D-E show examples of Gaussian random field with different kernel SD parameters.
