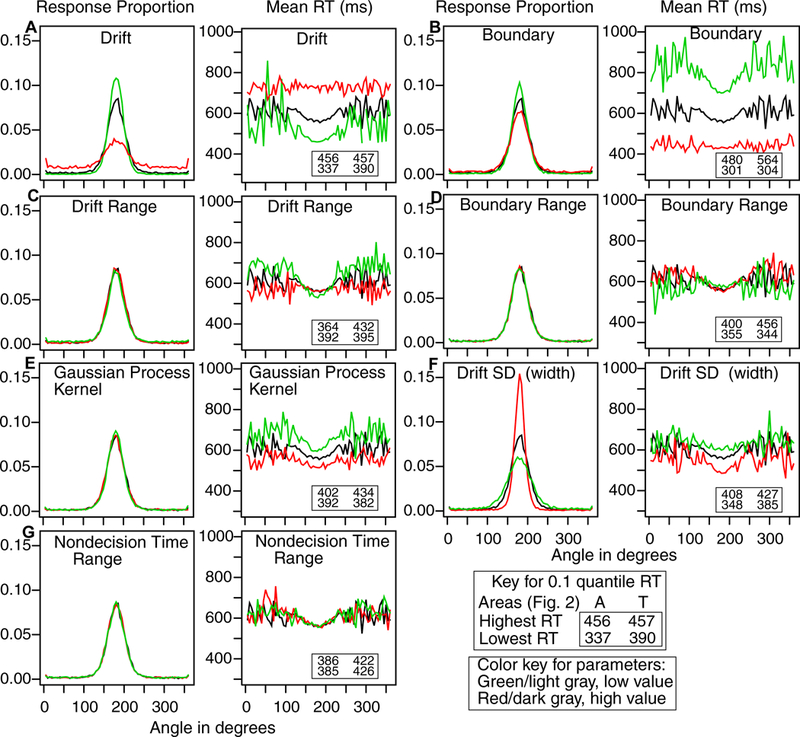
Figure A1.

Predictions for the parameter values in top line of Table A1 with the value of one parameter changed per panel. The values of the parameters changed are presented in the text. For each panel, the distribution of responses over position and mean RTs over position are shown. The inset for the mean RT plots show quantile RTs. The black lines in the plots are predictions for the parameter values in the top line of Table A1, the green/light gray lines are for low values of the parameter and the dark gray/red lines are for the high values of the parameter.
