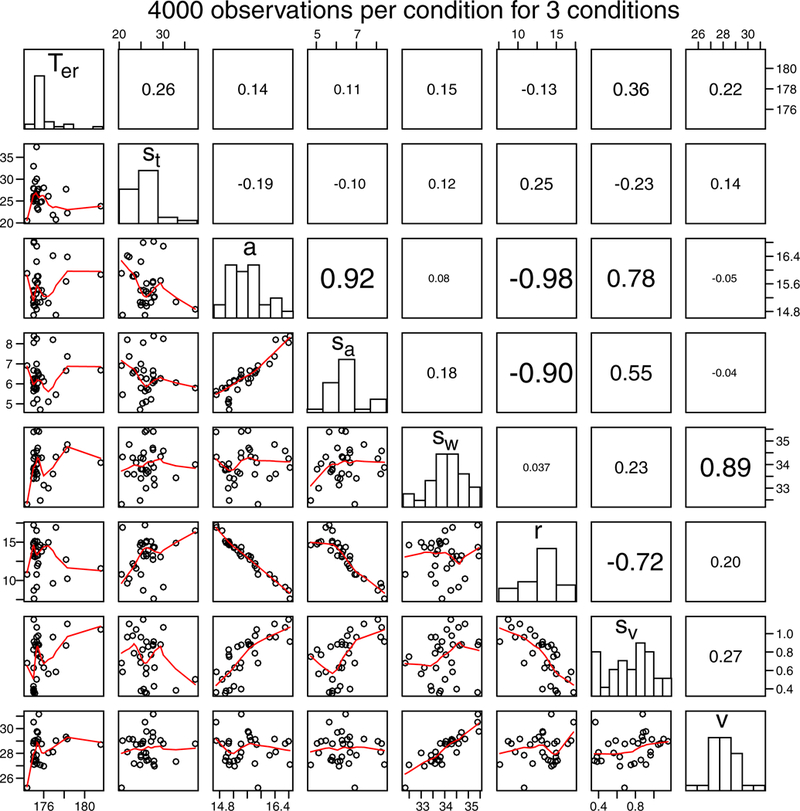
Figure A2.

Scatter plots, histograms, and correlations for SCDM model parameters for fits to simulated data with 40,000 observations per condition. Each dot represents the parameter values for one of the 32 simulated data sets. The identity of the comparison in each off-diagonal plot or correlation is obtained from the task labels in the corresponding horizontal and vertical diagonal plots. The lines in the scatter plots are lowess smoothers (from the R package).
