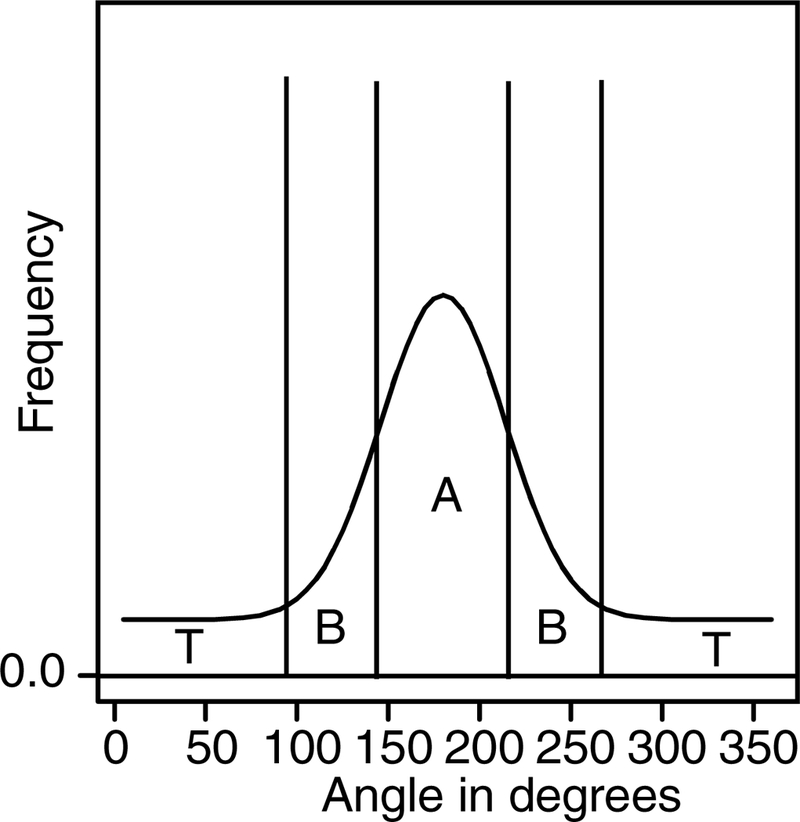
Figure 2.

A plot of a hypothetical distribution of responses showing how they are divided into the central proportion (A), the side lobes (B), and responses outside the stimulus range (T). This division is used to group the data to provide RT distributions for model fitting. When there were two or more possible targets, areas C, D, etc. were added for the weaker targets and these represented areas A and B combined for those stimuli.
