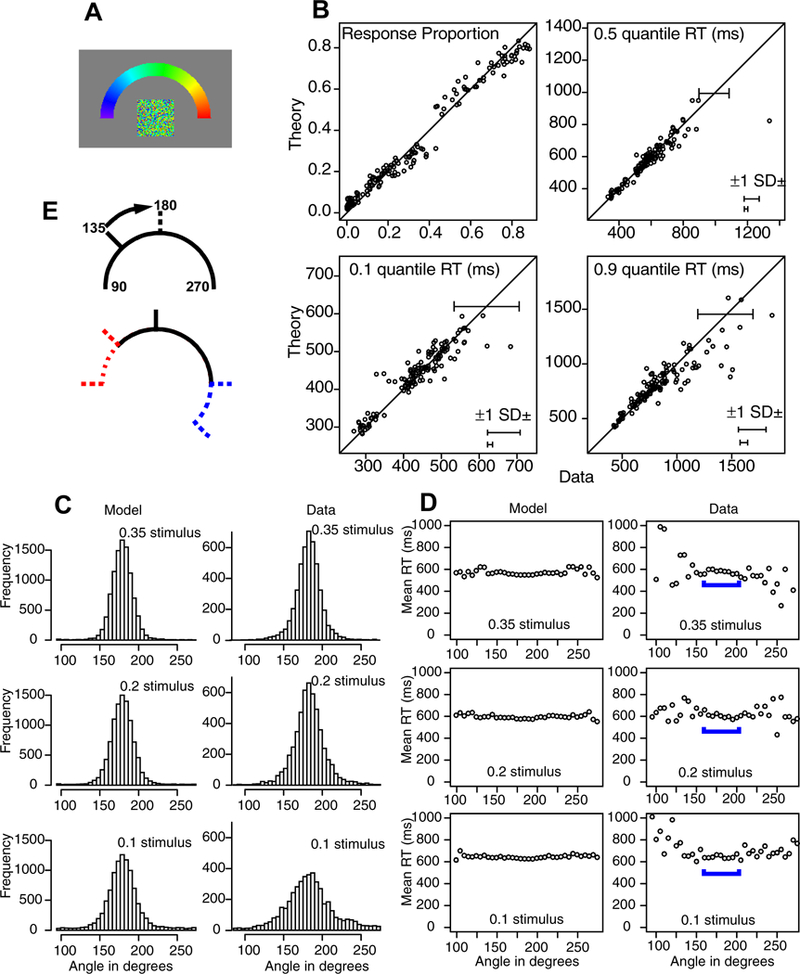
Figure 4.

The same analysis as in Figure 3 for Experiment 2. Panel E shows the result of aligning the stimuli at a common angle (180 degrees). Responses are lost (blue dashed line to the right) and areas contain no responses (red dashed line to the right). For full details, see the text.
