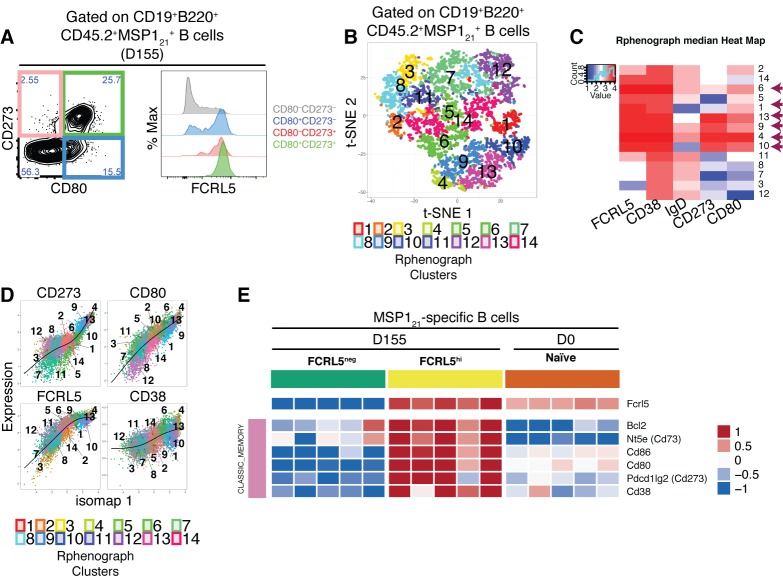
Figure 6. FCRL5hi identifies MSP121-specific Bmem after resolution of P.chabaudi infection.
(A) Flow cytometry showing expression of FCRL5 (right) on different subsets of splenic MSP121-specific B cells from NIMP23→Rag2-/- chimeric mice defined based on CD273 and CD80 expression (left) at 155dpi. (B) t-SNE analysis of splenic MSP121-specific B cells based on FCRL5, CD38, IgD, CD273 and CD80 expression measured by flow cytometry (n = 5). Clusters identified by PhenoGraph are colored and numbered. (C) PhenoGraph heat map showing median expression of FCRL5, CD38, IgD, CD273 and CD80 on the different clusters of MSP121-specific B cells. Arrows point at the different clusters displaying a memory B cell phenotype. (D) Expression profiles of FCRL5, CD38, CD273 and CD80 for the different PhenoGraph clusters visualized on the first component of ISOMAP. The regression line estimated using the generalized linear model (GLM) is added for each marker. Data representative of three independent experiments with 4–7 mice per group. (E) Heat map showing expression levels of different genes on splenic FCRL5— and FCRL5hi MSP121-specific B cells sorted at 155dpi, and MSP121-specific B cells sorted before infection (naïve), determined by RNAseq analysis. Each column corresponds to data from an individual mouse (n = 5 155 dpi, n = 5 0 dpi).


