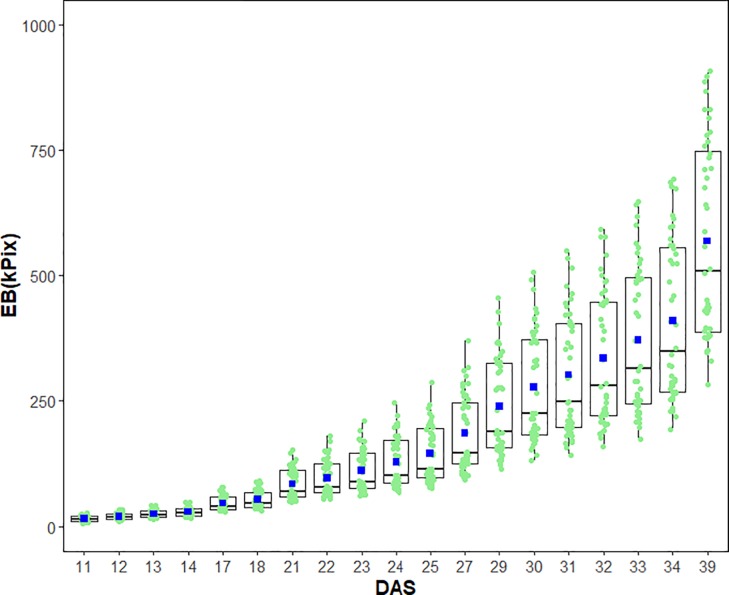
Fig 3. Dynamic growth of field pea genotypes.
Boxplots of the estimated shoot biomass accumulation over the growth period for 44 field pea genotypes. EB, estimated shoot biomass; DAS, days after sowing. In each box, the black line is the median; the blue squares are the mean; the light green dots are EB of individual field pea genotypes.

