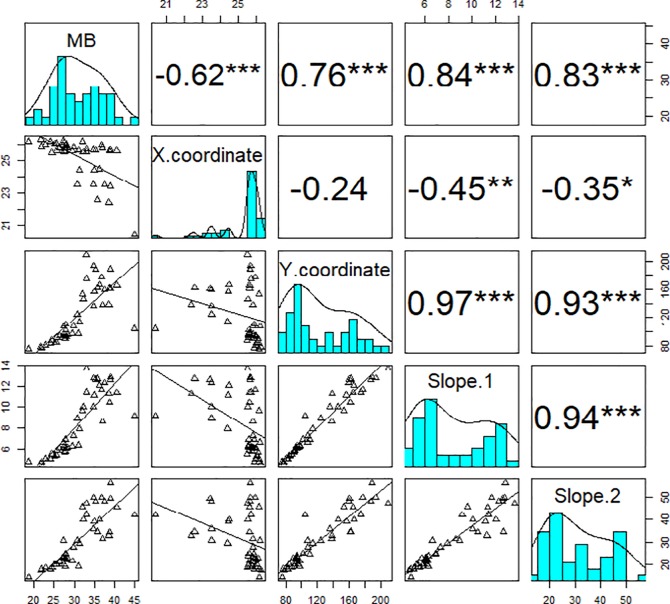
Fig 4. Relationship between early vigour of field pea genotypes and parameters of the “broken-stick” model.
The cyan panels are the histograms of measured biomass and parameters of the broken-stick model. Panels above and below the diagonal of each cyan panel are Pearson’s correlation coefficients and bivariate scatter plots with trend lines, respectively. The asterisks indicate the statistically significant level (*** p<0.001). MB, measured shoot biomass; X and Y coordinates, the reference points of the days after sowing and the estimated biomass at X; Slope 1, the coefficient before the break point; Slope 2, the coefficient after the break point; sample number = 44.

