
Figure 1.
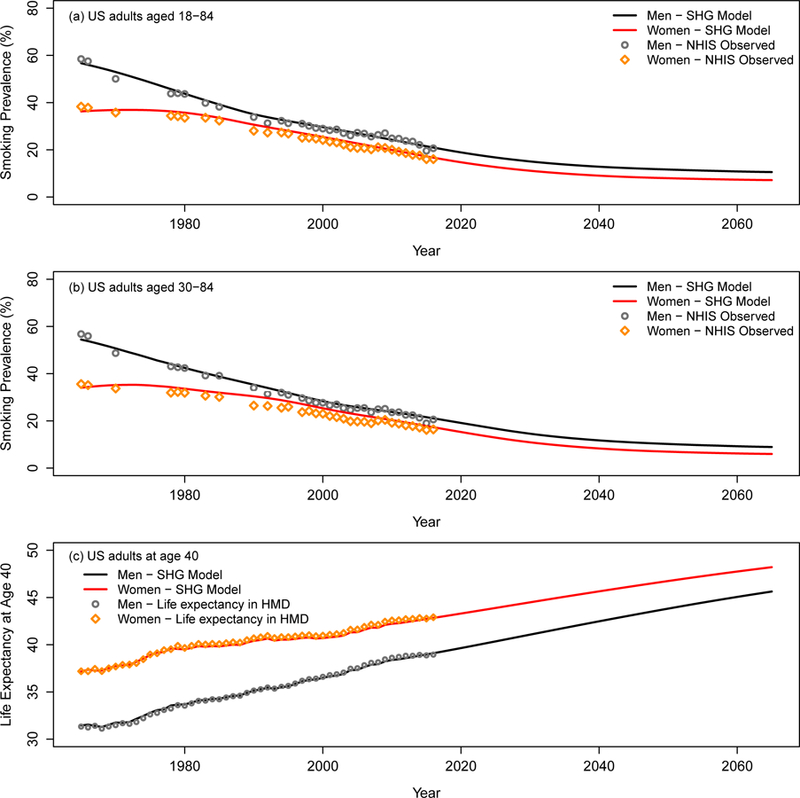
Smoking prevalence among US adults. (a) and (b) Smoking prevalence for US men and women aged 18–84 and 30–84, respectively. The observed smoking prevalence (points) includes current smokers and former smokers who quit smoking less than 2 years in the NHIS data. The line represents the estimates based on simulated smoking histories for the US population by the SHG. The smoking prevalence was projected up to year 2065 under the status quo scenario. (c) Life expectancy at age 40 under the status quo scenario. The line represents the estimates based on simulated smoking histories for the US population by the SHG and projected US population based on the Lee-Carter model. The points represent the corresponding life expectancy in the Human Mortality Database (HMD) data. An interactive version of the figure can be found at https://resources.cisnet.cancer.gov/projects/#shg/sbc2/tool?figure=fig_1.