
Figure 4.
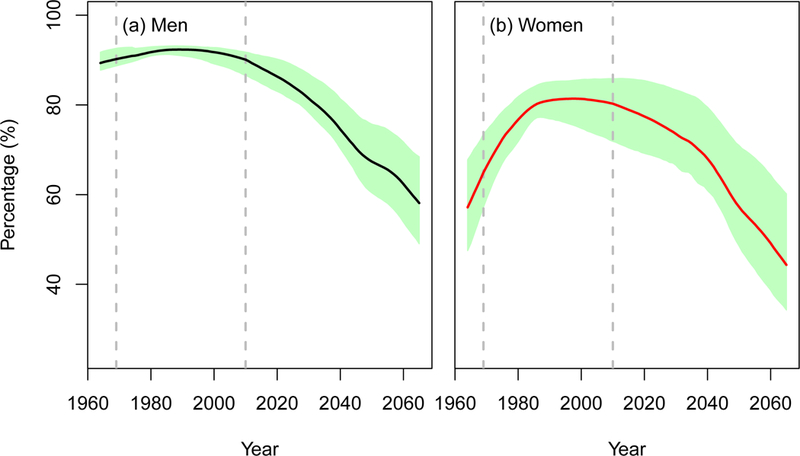
Population attributable fraction (PAF) of lung cancer deaths due to smoking in the US for 1964–2065 under the status quo scenario. The line in the middle represents the mean PAF across four CISNET-Lung models. The shaded area shows the range of PAF estimates across four models. An interactive version of the figure can be found at https://resources.cisnet.cancer.gov/projects/#shg/sbc2/tool?figure=fig_4.