
Figure 3.
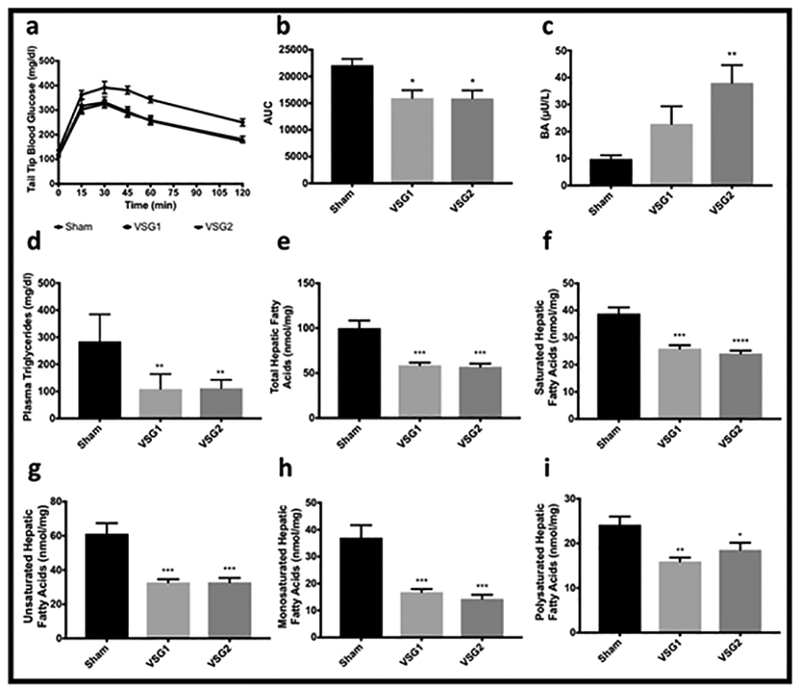
Glucose Handling, Bile Acids, and Plasma and Hepatic Lipids. Glucose levels at baseline and at different time points after injection of intraperitoneal dextrose 2g/kg (a). Area under the curve (AUC) for glucose levels over time obtained shown in a (b). Total fasted bile acids (c). Fasting plasma triglycerides by group (d). Total (e), saturated (f), unsaturated (g), monosaturated (h), and polysaturated (i) hepatic fatty acids by group (e). Graphs a-c include the entire cohort (Sham n=10; VSG1 n=12; VSG2 n=12). Graphs d-i include 6 randomly-selected rodents per group (Sham n=6; VSG1 n=6; VSG2 n=6). Analyses performed by Tukey’s multiple comparison test applied to values obtained from one-way analysis of variance (ANOVA). *, denotes statistical significance between Sham and VSG groups. ****, p < 0.0001; ***, p < 0.001; **, p<0.01; *, p<0.05.