
Figure 4.
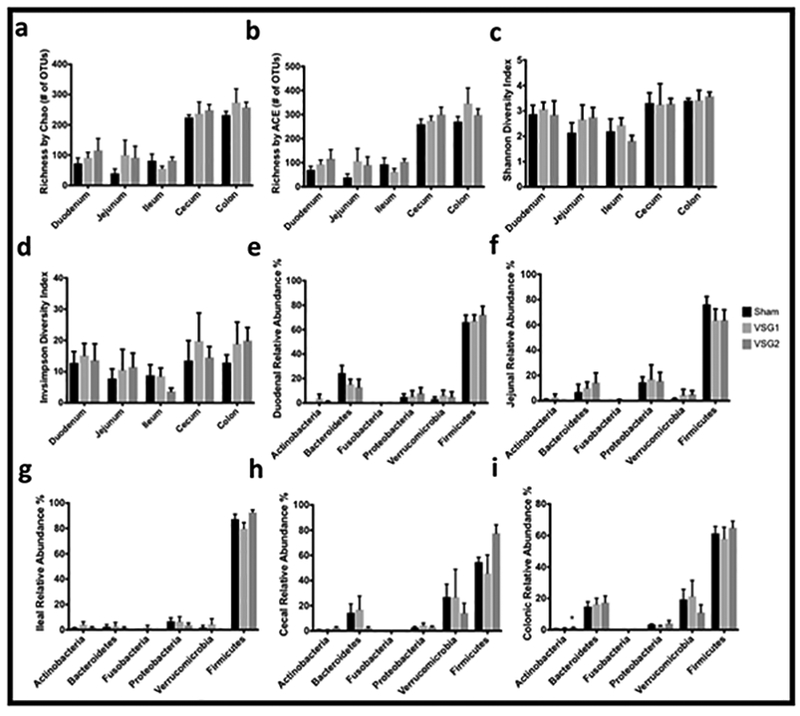
Microbial Community Richness and Diversity and Relative Abundances of Bacterial Phyla by Intestinal Section. Microbial community richness by Chao (a) and ACE (b). Microbial community diversity by Shannon (c) and Invsimpson (d). Relative abundances of duodenal (e), jejunal (f), ileal (g), cecal (h), and colonic (i) bacterial phyla. Graphs a-i include 6 randomly-selected rodents per group (Sham n=6; VSG1 n=6; VSG2 n=6). Analyses performed by Tukey’s multiple comparison test applied to values obtained from one-way analysis of variance (ANOVA). *, denotes statistical significance between Sham and VSG groups. *, p < 0.05.