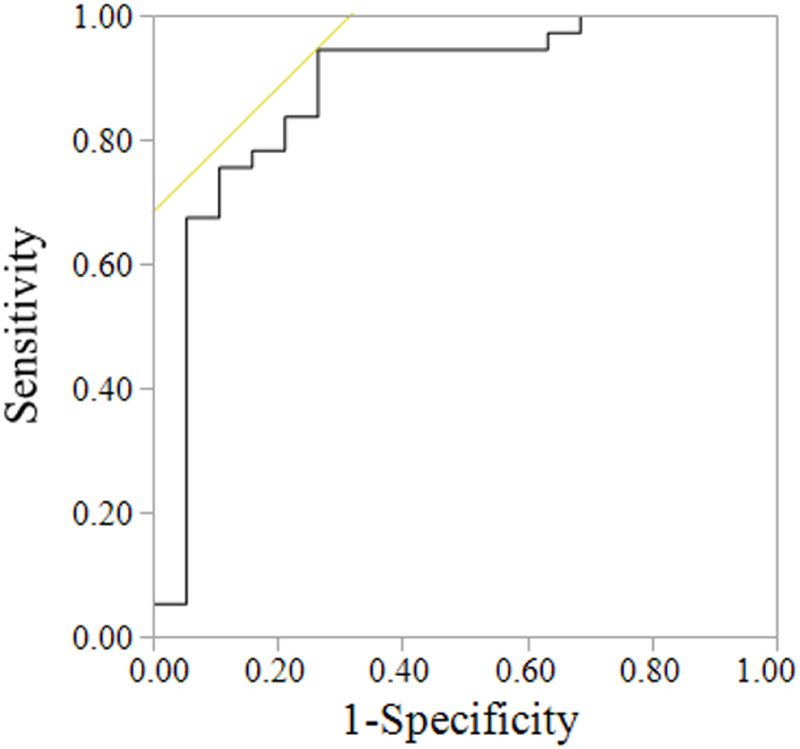
Figure 2: ROC curve analysis considering all HF and COPD patients.

The ROC curve identified a cutoff for V̇E intercept of ≥2.64 L/min to indicate patients with a high probability of having COPD (AUC: 0.88; p<0.01).

The ROC curve identified a cutoff for V̇E intercept of ≥2.64 L/min to indicate patients with a high probability of having COPD (AUC: 0.88; p<0.01).