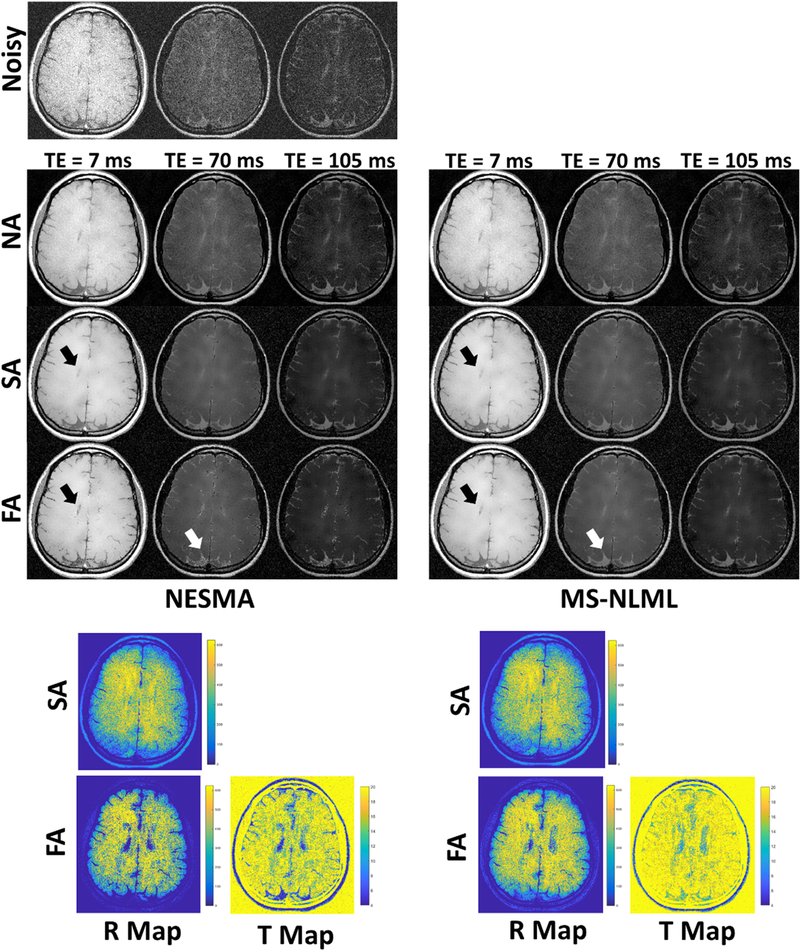
Figure 3.
Filtering performance of non-adaptive (NA), semi-adaptive (SA), and fully-adaptive (FA) NESMA and MS-NLML filters on an in vivo T2W dataset. Results are shown for three different TEs. The grayscale is consistent across filtered images and across TEs. Noisy images are shown for comparison. R-maps and T-maps show, respectively, number of voxels and threshold selected at each location for the NESMA and MS-NLML filters. SA-NESMA and SAMS-NLML filtered images show similar noise reduction. However, FA-NESMA and FA-MSNLML show slight differences in filtering, which can be attributed to the FA method selecting different values for R (white arrows). Also, it can be seen in the ventricles that the FA method selected fewer voxels compared to the SA method, leading to less blurring (black arrows).

