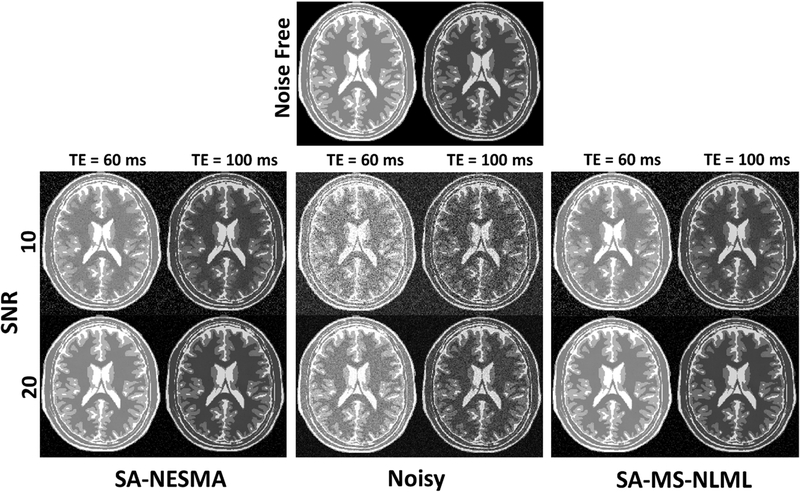
Figure 4.
Filtering performance of SA-NESMA and SA-MS-NLML on synthetic datasets of SNR 10 and 25. Two TEs are shown to illustrate each filter’s performance at different contrasts. The grayscale is consistent across filtered images and across TEs. Noisy images are shown for comparison. The thresholds used for both filters were 10% and 5% for SNR 10 and 25 respectively. The filtered images demonstrate that the NESMA and MS-MLML denoising methods differ minutely, if at all, even at very low SNR.

