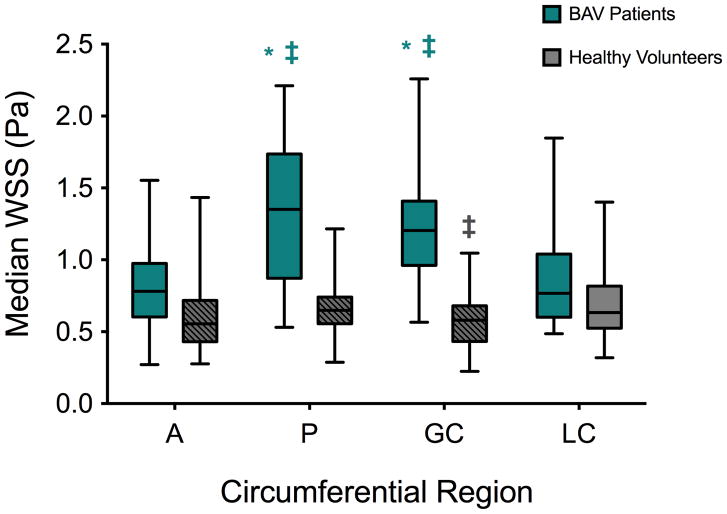
Figure 3.
Aortic wall shear stress (WSS) assessed using 4D flow MRI in BAV patients (blue) and healthy volunteers (grey) according to the circumferential location, while pooling the proximal and distal ascending aorta (A: anterior; P: posterior: GC: greater and LC: lesser curvature). Columns illustrate median values while error bars indicate interquartile ranges. Hashed regions: p<0.05 against BAV patients. *: p<0.05 for comparison against A; ‡: against LC, within each group.

