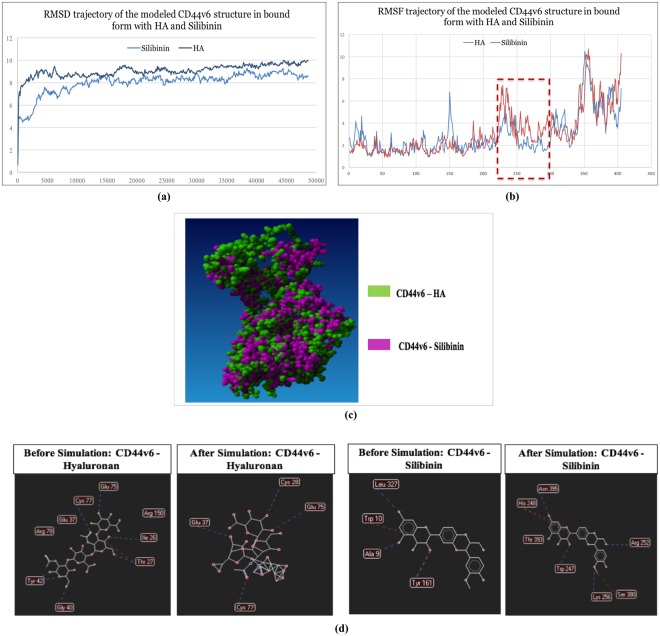
Figure 2.
Molecular dynamics, molecular modeling and structural perturbation analysis of CD44v6 by selected potential drug compound. (a) RMSD trajectory analysis of the modeled CD44v6 structure in bound form with HA and Silibinin during 50 ns long MD simulations. Notes: Duration of MD simulations scaled on X-axis and Y-axis on the left side represents the RMSD deviation of protein structure in Å. Y-axis on the right side represents the HA ligand RMSD trajectory in their respective binding pockets. (b) RMSF analysis of the modeled CD44v6 structure in bound form with HA and Silibinin during 50 ns long MD simulations. The highlighted regions (red) is depicting ligand induced internal residual fluctuations in CD44v6 structure captured during MD simulation process. (c) 3D representation of the superimposed complexes of CD44v6 bound to HA (green) and Silibinin (pink) respectively demonstrating ligand induced conformational change in the structure of CD44v6 protein. (d) Difference in H-bond interaction profile of CD44v6 with HA and Silibinin before and after MD simulation process.

