Figure 5.
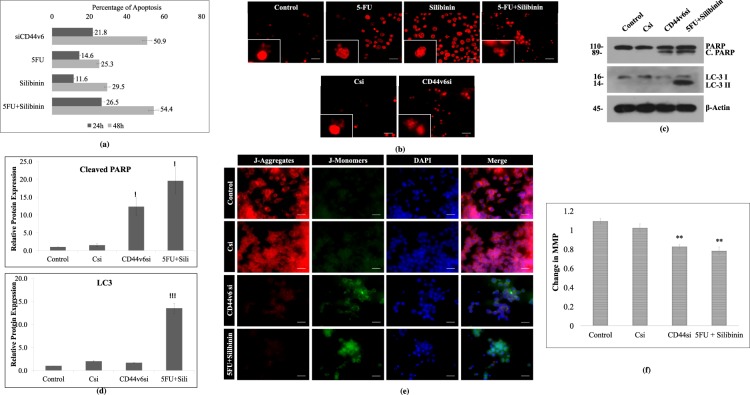
Enhanced effect of 5FU+ Silibinin combinatorial treatment on apoptotic mechanism of CD44+ subpopulation. (a) Apoptotic cell death analysis was conducted by Annexin-V/PI staining of CD44v6 siRNA (10 nM), 5FU (10 μM), Silibinin (250 μM) and 5FU+ Silibinin (10 + 50 μM) treated cells as compared to untreated cells using the MuseTM analyser. The graph indicates the percentage of apoptotic and live cells in treated cells compared to untreated cell population. Error bars represent mean ± SEM of three independent experiments with p-value indicated as *p < 0.05, **p < 0.01 and ***p < 0.001. (b) Nuclear morphology and fragmentation of CD44v6 siRNA (10 nM), 5FU (10 μM), Silibinin (250 μM) and 5FU+ Silibinin (10 + 50 μM) treated cells were stained with PI and observed under fluorescent microscope. Scale bar:10 μm. (c) Western Blot analysis of PARP cleavage and LC-3 I/II conversion in HCT116 derived CD44+ cells upon CD44v6 knockdown (10 nM) and combinatorial treatment of 5FU+ Silibinin (10 + 50 μM). β-actin was used as a loading control. (d) Densitometric analysis of western blot bands of PARP cleavage and LC-3 I/II conversion post treatment with CD44v6 siRNA and 5FU+ Silibinin compared to their control counterparts. Error bars represent mean ± SEM of three independent experiments with p-value indicated as *p < 0.05, **p < 0.01 and ***p < 0.001. (e) Analysis of changes in mitochondrial membrane potential (MMP) via JC-1 dye by fluorescence microscopy. Scale bar: 10 μm. (f) Quantitative analysis of loss of mitochondrial membrane potential (Ψ). Error bars represent mean ± SEM of three independent experiments with p-value indicated as *p < 0.05, **p < 0.01 and ***p < 0.001.

