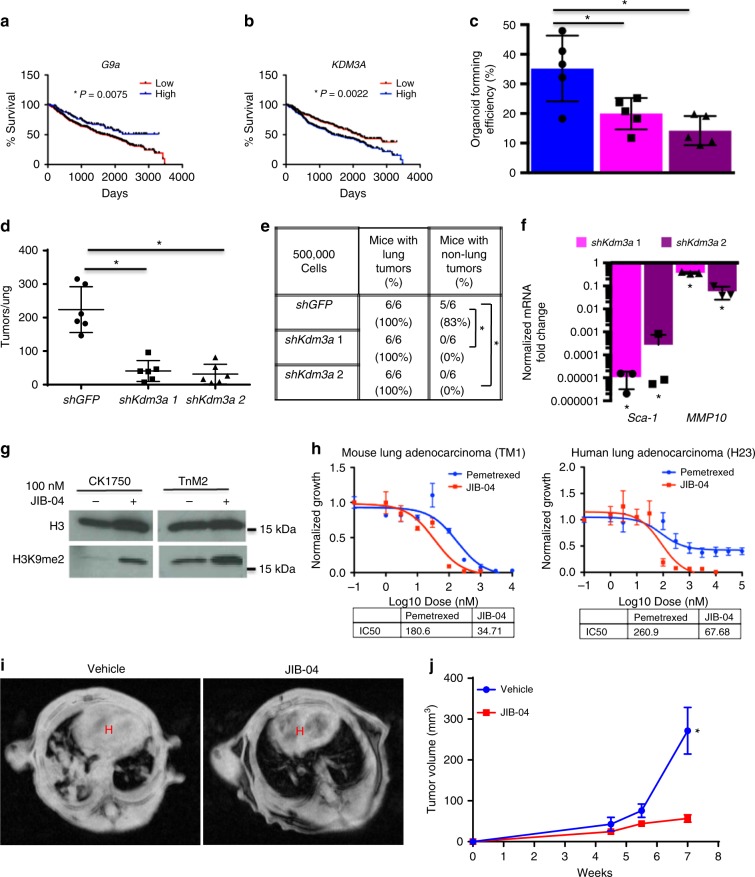
Fig. 4.
Antagonizing H3K9 KDMs represses TPC phenotypes. a, b Kaplan–Meier curves of 10-year survival of patients from the director’s challenge cohort of early stage lung adenocarcinoma. Populations sorted for high and low expression of a H3K9me1/2 G9a and b H3K9me1/2 demethylase KDM3A. *P < 0.05, Mantel–Cox log-rank test. c Bar chart of % of cells forming organoids 10 days after 1000 shGFP and shKdm3a CK1750 adenocarcinoma cells were plated in 3D culture. Error bars denote standard deviation. *P < 0.05, Fisher’s t test, n = 4. d Chart of average number of tumors per H&E-stained section from recipients of intravenously transplanted shGFP and shKdm3a adenocarcinoma cells. *P < 0.05, Mann–Whitney test. e Table of transplanted mice with lung and non-lung tumors. *P < 0.05, Fisher’s exact test. f Bar chart of fold change of Gapdh-normalized mRNA levels of indicated genes in shKdm3a adenocarcinoma cells over shGFP control cells. Error bars denote standard deviation. *P < 0.05, Fisher’s t test, n = 3. g Western blot of whole cell lysates from CK1750 adenocarcinoma cells treated with either 100 nM JIB-04 or DMSO for 96 h, and then immunoblotted for the indicated antibodies. h Representative dose–response curve of mouse (TM1) and human (H23) NSCLC cells grown for 96 h with JIB-04 or Pemetrexed, normalized to growth with vehicle control. i Representative MR images of allograft mice treated with vehicle or JIB-04 at 7 weeks post transplantation. H indicates heart area. j Chart of average tumor volume of allografted mice treated with either vehicle or JIB-04. *P < 0.05, Fisher’s t test

