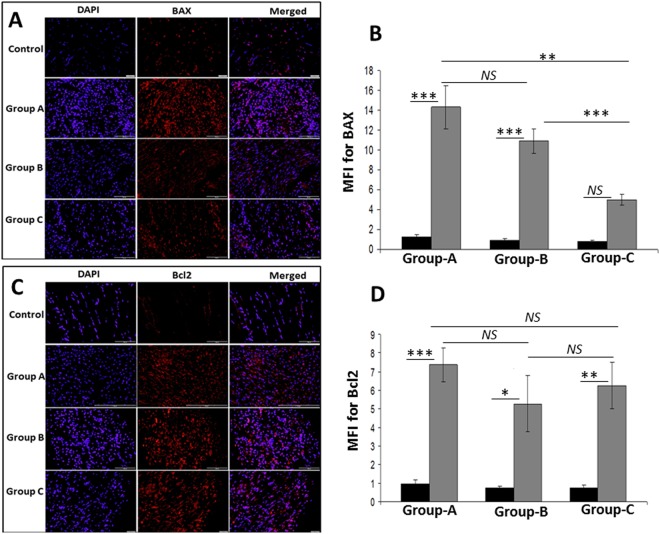
Figure 2.
Immunofluorescence analysis for the expression of (A) BAX and (C) Bcl2 showing increased expression in RCI group on comparison with control. Images in the top row are histological sections of control group, and images in the bottom rows are histological sections of RCI tendons harvested at 3–5 days (Group-A), 10–12 days (Group-B) and 22–24 days (Group-C). Images in the left column show nuclear staining with DAPI; the images in the middle column show expression of BAX/Bcl2 while the images in the right column show overlay of BAX/Bcl2 staining with DAPI. Images were acquired at 20x magnification using CCD camera attached to the Olympus microscope. (B,D) The image shows quantification of the expression of BAX and Bcl2. The intensity of protein expression as observed through immunofluorescence was acquired and the mean fluorescence intensity (MFI) was quantified from each contralateral control and RCI specimen. The graphs represent MFI mean values with standard error. The statistical significance of each contralateral control groups vs RCI groups and between RCI groups are represented in the figure (n = 7; NS – non-significant, *P < 0.05, **P < 0.01 and ***P < 0.001) and the P values for RCI specimen within and between the groups are displayed in Supplementary Table 1.

