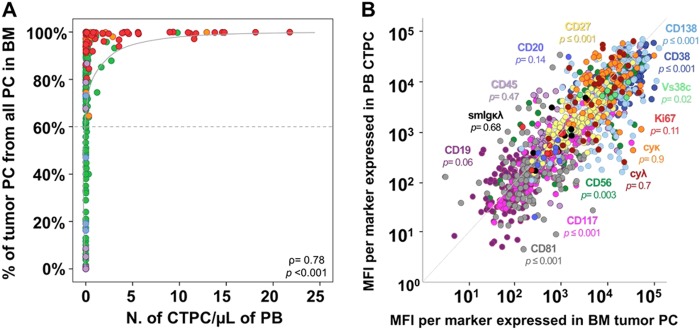
Fig. 2. Correlation between the number and immunophenotype of tumor PCs in paired PB and BM samples from newly diagnosed PCN patients.
Correlation between the percentage of TPC from all BMPC and the absolute PB CTPC counts in paired BM and PB samples are shown in a, while the correlation between median fluorescence intensity (MFI) levels of expression of individual phenotypic markers in paired BM TPC vs. PB CTPC are displayed in b. In a, dots are colored per diagnostic category as follows: SP patients are color-coded as purple circles, macrofocalMM as light blue circles, MGUS cases are represented as green circles, SMM as orange circles, and MM as red circles. The dotted line represents the percentage of BM TPC above, which CTPC are usually detected in PB of PCN patients (91% vs. 9% cases with CTPC were found for patients above and below the line, respectively). In b, individual phenotypic markers are color-coded as follows: CD38, dark blue; CD56, dark green; CD45, light purple; CD19, dark purple; CD117, pink; CD81, gray; CD138, light blue; CD27, yellow; CyKappa, orange; CyLambda; brown; Vs38c, light green; SmKappa + SmLambda, black; Ki67, red; and, CD20, blue. PB peripheral blood, BM bone marrow, PC plasma cell, TPC tumor PC, CTPC circulating tumor PC, NPC normal PC, PCN PC neoplasms, MFI median fluorescence intensity, SP solitary plasmacytoma, macrofocalMM macrofocal MM, MGUS monoclonal gammopathy of undetermined significance, SMM smoldering MM, MM multiple myeloma

