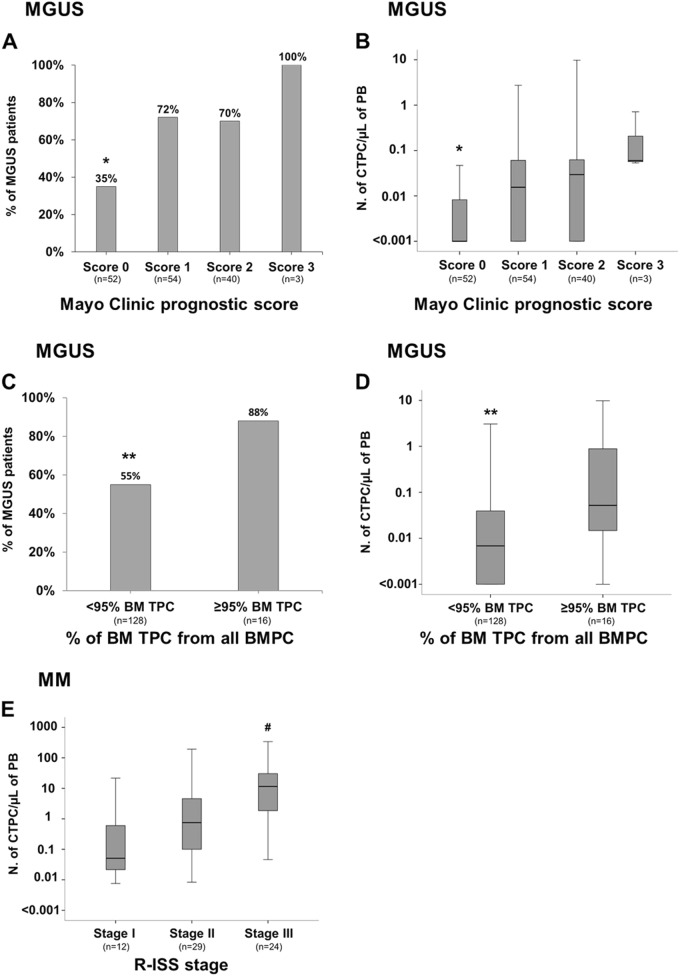
Fig. 3. Frequency and distribution of circulating tumor PC in PB of MGUS and MM patients classified into distinct risk-groups and clinical stages, respectively.
Frequency of MGUS patients presenting with CTPC and their absolute counts according to the Mayo Clinic prognostic index (a and b, respectively; *p < 0.05 for Mayo Clinic prognostic score 0 vs. scores 1, 2, and 3) and the distribution of TPC within the whole BMPC compartment (<95% vs. ≥ 95%) (c and d, respectively; **p < 0.05 vs. ≥ 95% TPC from all BM PC). In e, the absolute counts of PB TPC in MM patients distributed according to the R-ISS stages is shown (#p < 0.05 for stage III vs. stages I and II). Boxes extend from the 25th to the 75th percentile values; the line in the middle and vertical lines correspond to the median value and the 10th and 90th percentiles, respectively. PC plasma cell, TPC tumor PC, CTPC circulating tumor PC, PB peripheral blood, BM bone marrow, MGUS monoclonal gammopathy of undetermined significance, MM multiple myeloma, R-ISS revised international staging system

