Fig. 6.
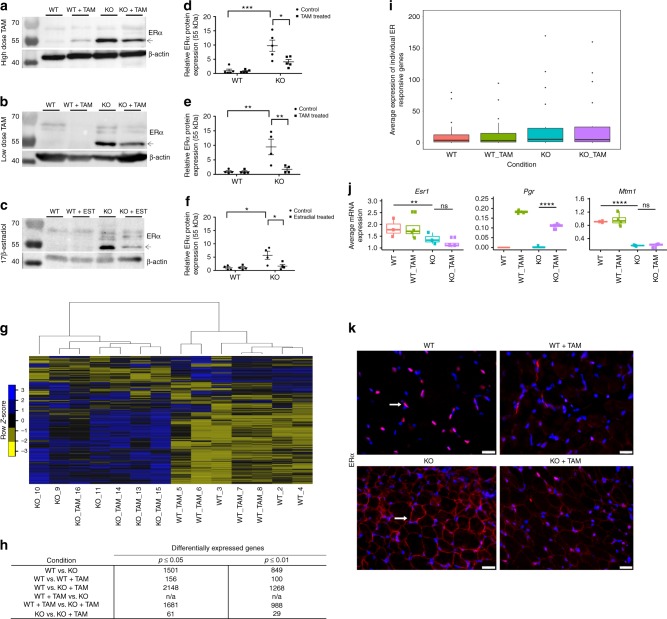
Tamoxifen treatment does not alter the Mtm1 knockout transcriptome. a–c Representative western blots for ERα (with β-actin loading control) for WT, WT + TAM, Mtm1 KO, and tamoxifen (TAM) treated Mtm1 KO mice (molecular weight markers indicated in kDa). d–f Quantification of protein levels of the 55 kDa isoform of ERα as determined by densitometry with standardization to β-actin and represented as fold difference from the average of WT (n = 5 mice per group for high-dose TAM, n = 4 mice per group for low-dose TAM and estradiol. Statistical analyses were conducted by two-way ANOVA, followed by Tukey’s multiple comparisons post-test *p < 0.05, **p < 0.01, ***p < 0.001, ****p < 0.0001. Complete data points presented in Supplementary Table 4. g Heat map indicating overall mRNA expression profiles (derived from RNA-seq) of the four experimental groups, blue = high expression, yellow = low expression. Mtm1 KO and Mtm1 KO + TAM heat maps cluster together and are distinct from WT and WT + TAM. h Table indicating the total number of gene transcripts in each comparison with significantly differentially expression (n = 3 mice per group for WT, n = 4 for WT + TAM, n = 3 for KO, and n = 4 for KO + TAM). Note that only 29 genes are differentially expressed (p ≤ 0.01, DEseq and EdgeR R/Bioconductor pairwise comparisons) in Mtm1 KO vs. Mtm1 KO + TAM. i Box plot indicating the average expression of 21 estrogen receptor-responsive genes within each experimental group; no overall differences are observed with TAM treatment. j Individual expression box plots of Esr1 and Pgr1, the only significantly changed estrogen response genes, and of Mtm1. Box plots show the median, the 25th and 75th percentiles, and outliers. k Immunofluorescence with anti-ERα (red; indicated by a white arrow) on tibialis anterior muscle sections from WT, WT + TAM, Mtm1 KO, and Mtm1 KO + TAM (blue = DAPI) (n = 3 mice per group for WT and WT + TAM, n = 4 mice per group for KO and KO + TAM). ERα is expressed primarily in the nucleus in WT muscle (arrow) but found at the sarcolemmal membrane in Mtm1 KOs (arrow). Overall ERα expression and its membrane localization are reduced with TAM treatment. Scale bars = 20 µm

